- Home >
- Stock Photos >
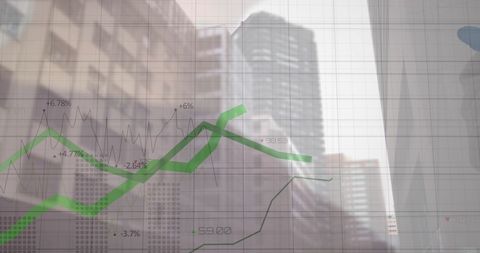
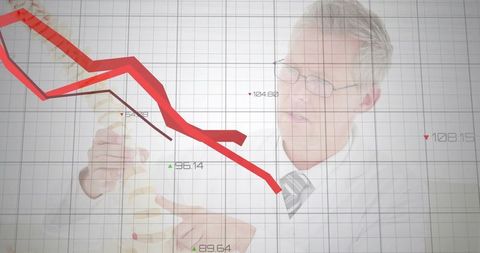
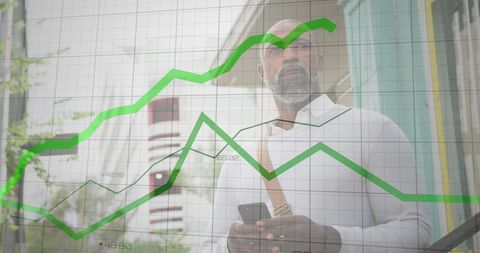
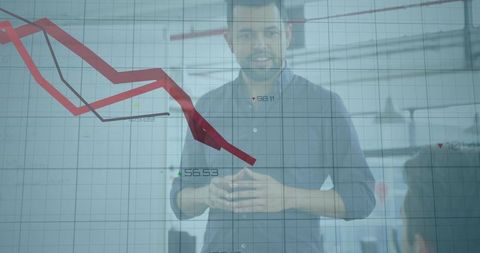
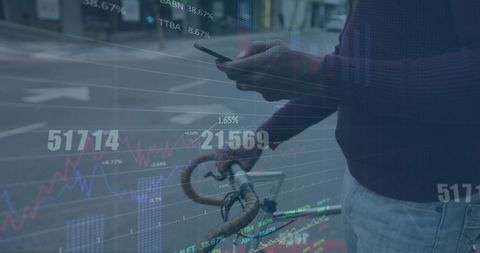
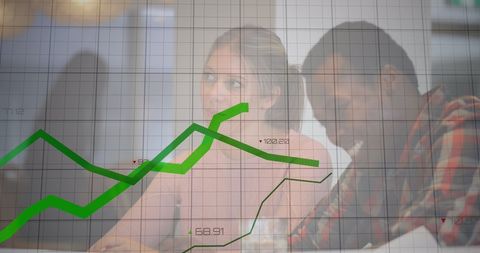
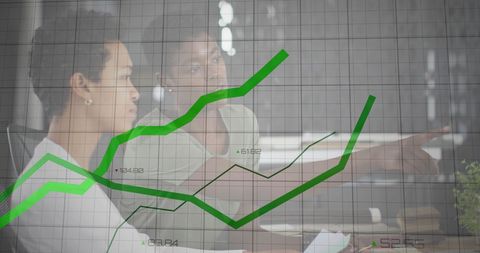
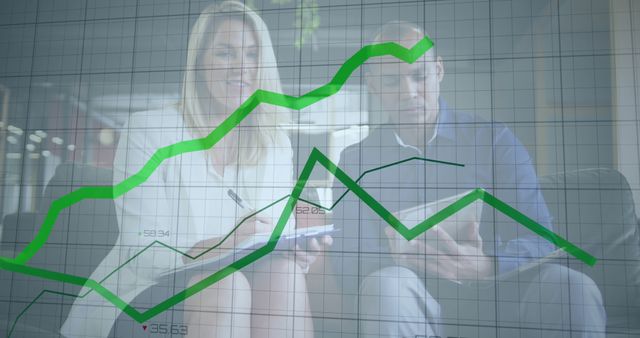
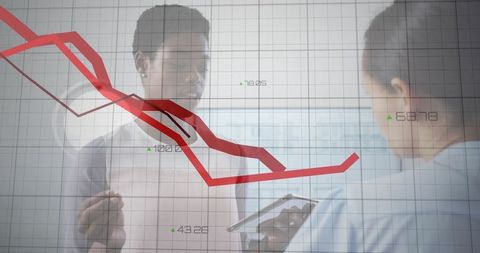
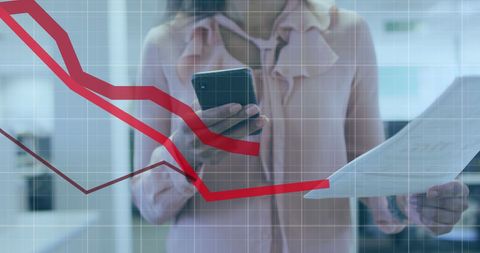
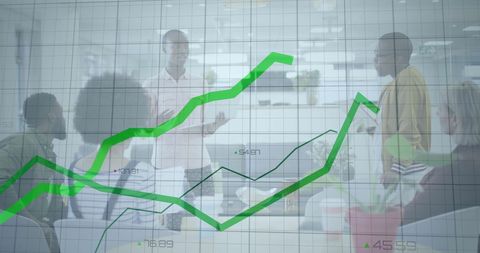
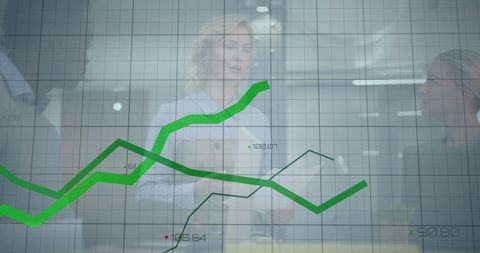
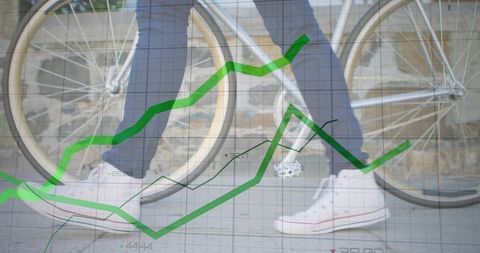
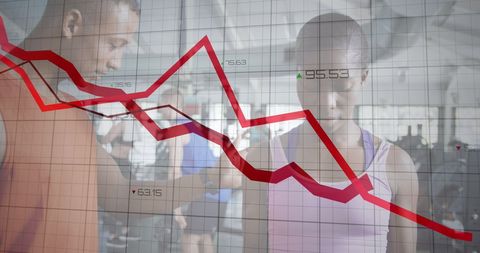
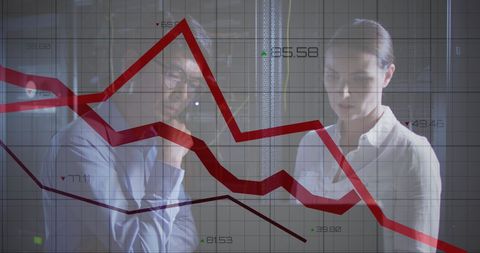
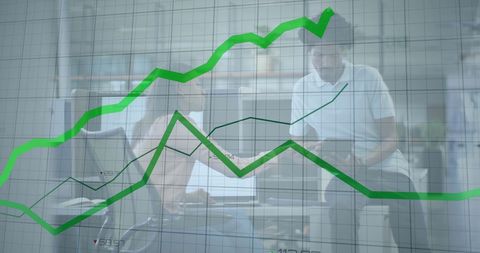
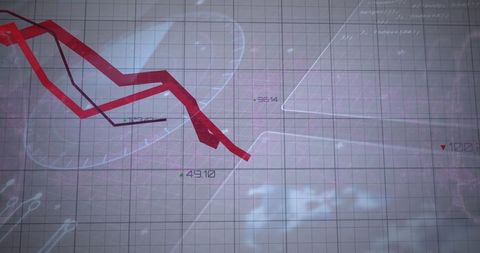
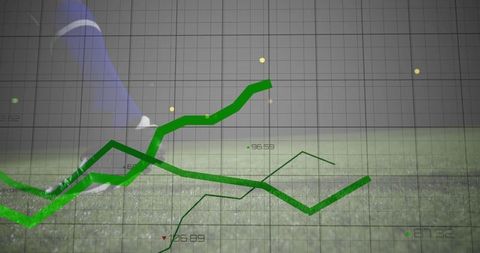
- Financial Analysis Concept with Smartphone Usage
Financial Analysis Concept with Smartphone Usage Image
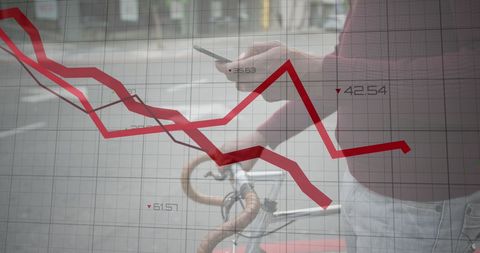
Dynamic image blending outdoor smartphone usage and financial data graph. Highlighting the intersection of modern technology with financial markets and analytics. Suitable for illustrating global business trends, economic analysis, or technology in finance visuals.

downloads
Tags:
More
Credit Photo
If you would like to credit the Photo, here are some ways you can do so
Text Link
photo Link
<span class="text-link">
<span>
<a target="_blank" href=https://pikwizard.com/photo/financial-analysis-concept-with-smartphone-usage/260759b89d60ab5b8bc7f4531bc76e8f/>PikWizard</a>
</span>
</span>
<span class="image-link">
<span
style="margin: 0 0 20px 0; display: inline-block; vertical-align: middle; width: 100%;"
>
<a
target="_blank"
href="https://pikwizard.com/photo/financial-analysis-concept-with-smartphone-usage/260759b89d60ab5b8bc7f4531bc76e8f/"
style="text-decoration: none; font-size: 10px; margin: 0;"
>
<img src="https://pikwizard.com/pw/medium/260759b89d60ab5b8bc7f4531bc76e8f.jpg" style="margin: 0; width: 100%;" alt="" />
<p style="font-size: 12px; margin: 0;">PikWizard</p>
</a>
</span>
</span>
Free (free of charge)
Free for personal and commercial use.
Author: Awesome Content