- Home >
- Stock Photos >
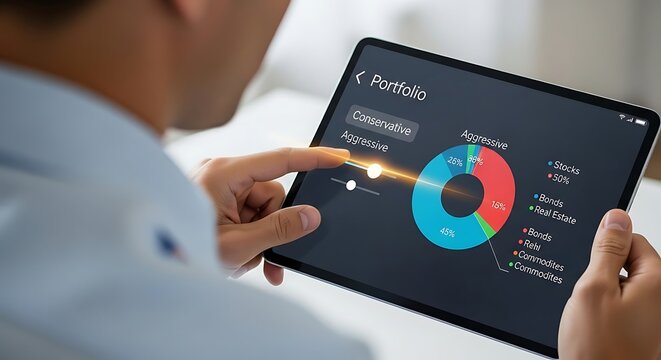
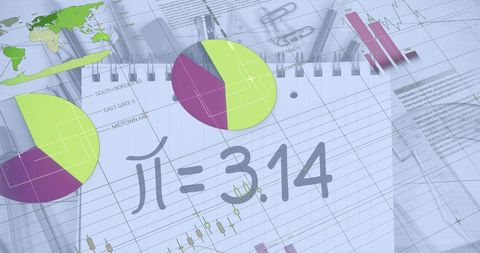
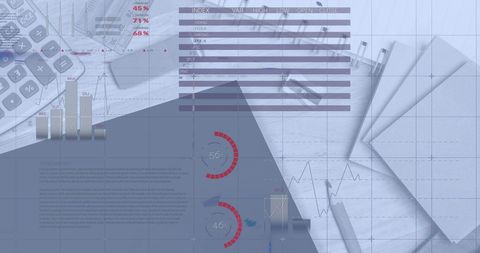
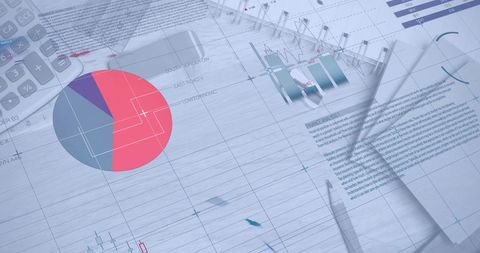
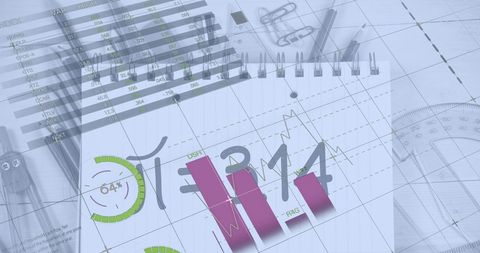
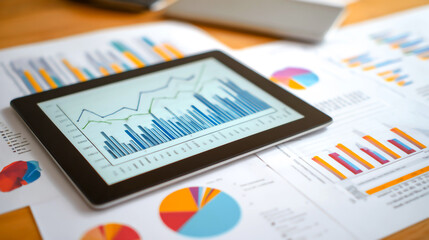
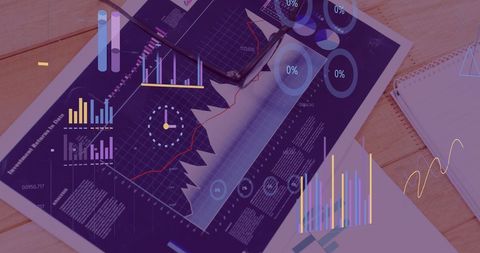
- Financial Analysis on Digital Tablet on Wooden Desk
Financial Analysis on Digital Tablet on Wooden Desk Image

Blurred financial data displayed over wooden desk with digital tablet, signifying technology's role in modern business. Useful for portraying themes of financial strategy, analysis, and tech-driven data management.
Powered by 


4
downloads
downloads
Tags:
More
Credit Photo
If you would like to credit the Photo, here are some ways you can do so
Text Link
photo Link
<span class="text-link">
<span>
<a target="_blank" href=https://pikwizard.com/photo/financial-analysis-on-digital-tablet-on-wooden-desk/06c4b30a836e3fd075af63d9211b62e7/>PikWizard</a>
</span>
</span>
<span class="image-link">
<span
style="margin: 0 0 20px 0; display: inline-block; vertical-align: middle; width: 100%;"
>
<a
target="_blank"
href="https://pikwizard.com/photo/financial-analysis-on-digital-tablet-on-wooden-desk/06c4b30a836e3fd075af63d9211b62e7/"
style="text-decoration: none; font-size: 10px; margin: 0;"
>
<img src="https://pikwizard.com/pw/medium/06c4b30a836e3fd075af63d9211b62e7.jpg" style="margin: 0; width: 100%;" alt="" />
<p style="font-size: 12px; margin: 0;">PikWizard</p>
</a>
</span>
</span>
Free (free of charge)
Free for personal and commercial use.
Author: Creative Art
Similar Free Stock Images
Loading...

Premium


Premium

Premium


Premium


Premium


Premium


Premium


Premium


Premium


Premium

Premium


Premium

Premium


Premium


Premium


Premium

Premium

Premium


Premium


Premium


Premium

Premium


Premium


Premium

Premium