- Home >
- Stock Photos >
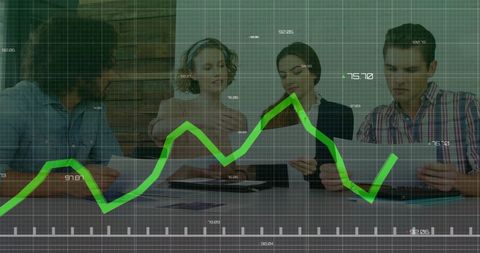
- Financial Analysis with Businesswoman and Digital Graphs
Financial Analysis with Businesswoman and Digital Graphs Image

Visual demonstrating financial analysis, combines elements like businesswoman and digital graphs for strategic planning concepts. Suitable for use in finance-themed content, presentations on business analytics, or corporate training materials emphasizing technology's role in modern business.
Powered by 


0
downloads
downloads
Tags:
More
Credit Photo
If you would like to credit the Photo, here are some ways you can do so
Text Link
photo Link
<span class="text-link">
<span>
<a target="_blank" href=https://pikwizard.com/photo/financial-analysis-with-businesswoman-and-digital-graphs/28d09de6a70894df4b08e654b47beb30/>PikWizard</a>
</span>
</span>
<span class="image-link">
<span
style="margin: 0 0 20px 0; display: inline-block; vertical-align: middle; width: 100%;"
>
<a
target="_blank"
href="https://pikwizard.com/photo/financial-analysis-with-businesswoman-and-digital-graphs/28d09de6a70894df4b08e654b47beb30/"
style="text-decoration: none; font-size: 10px; margin: 0;"
>
<img src="https://pikwizard.com/pw/medium/28d09de6a70894df4b08e654b47beb30.jpg" style="margin: 0; width: 100%;" alt="" />
<p style="font-size: 12px; margin: 0;">PikWizard</p>
</a>
</span>
</span>
Free (free of charge)
Free for personal and commercial use.
Author: Creative Art
Similar Free Stock Images

Premium


Premium


Premium


Premium


Premium


Premium


Premium


Premium


Premium


Premium


Premium


Premium


Premium


Premium


Premium


Premium


Premium


Premium


Premium


Premium


Premium


Premium


Premium


Premium


Premium