- Home >
- Stock Photos >
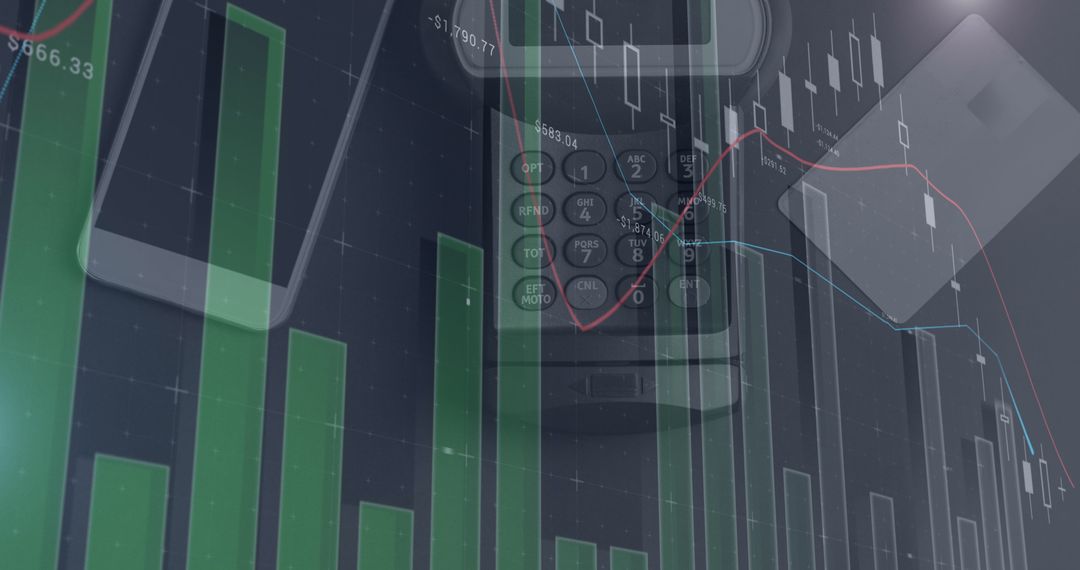
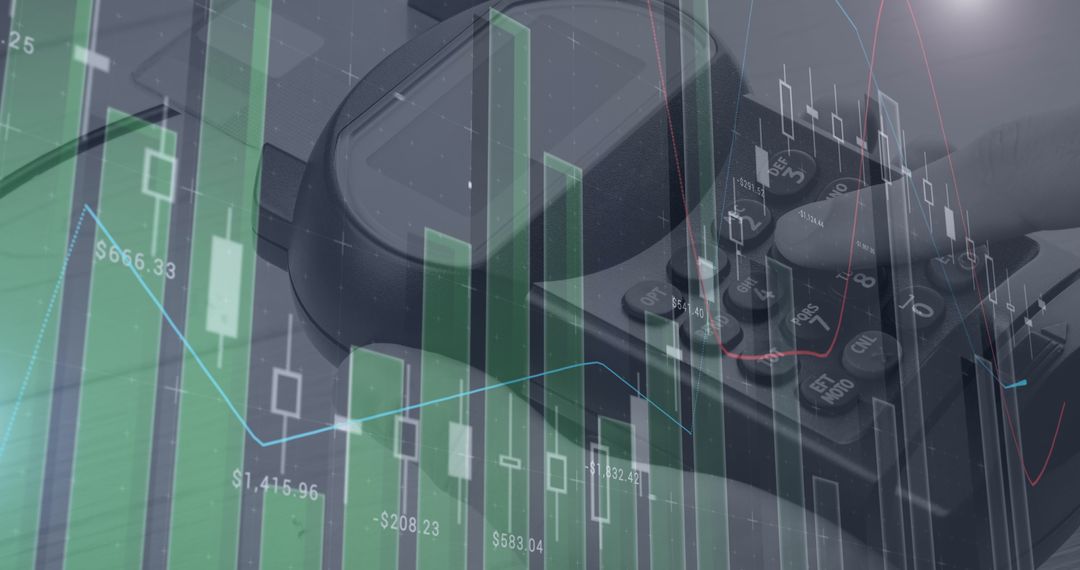
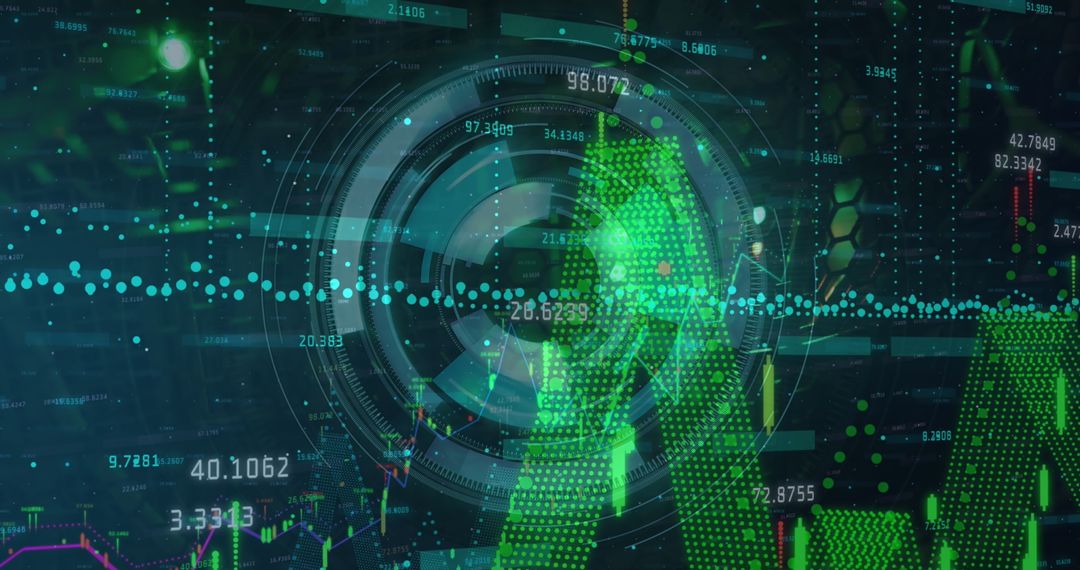
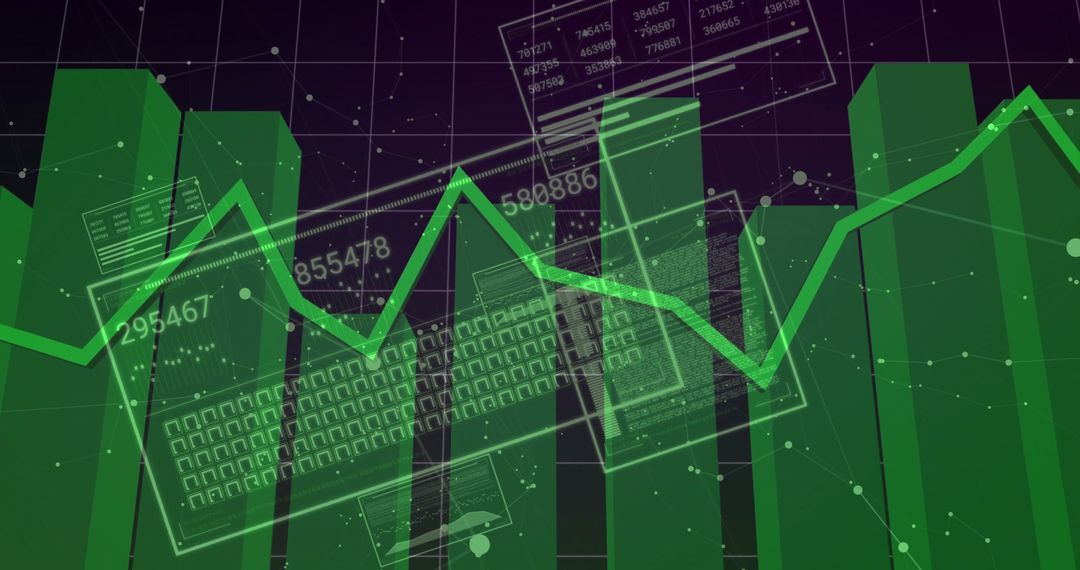
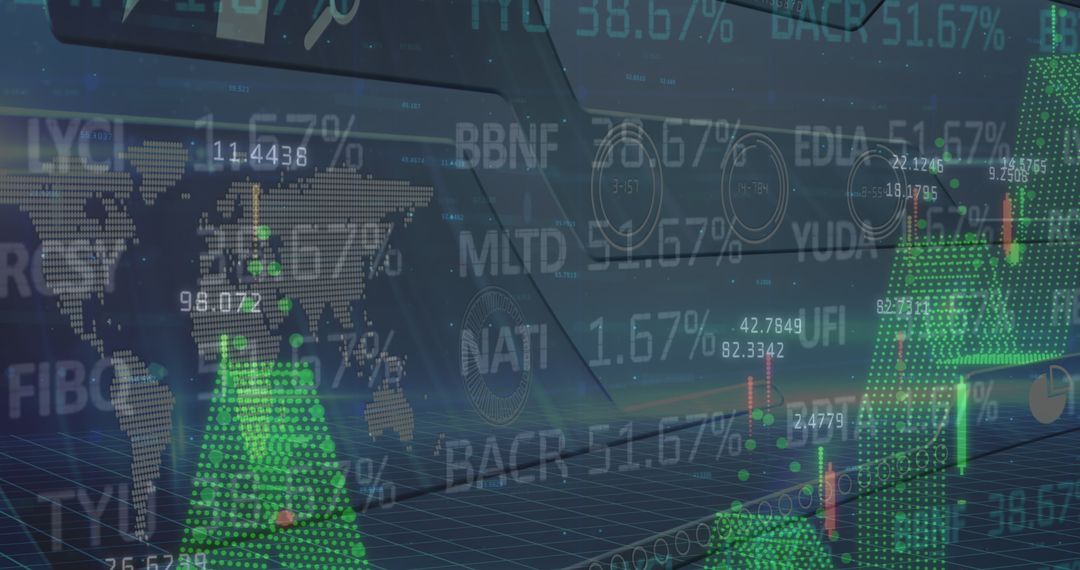
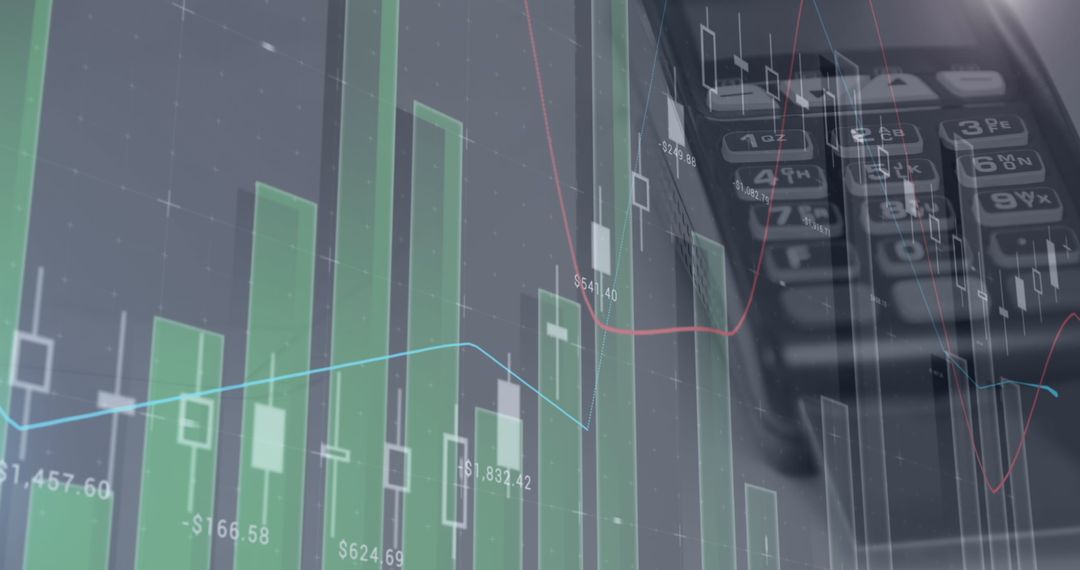
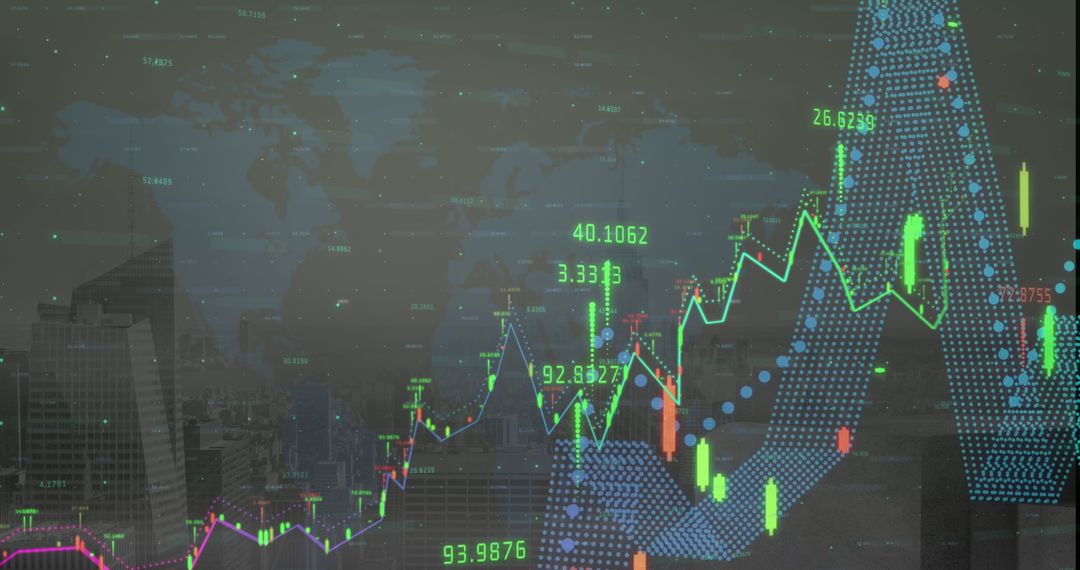
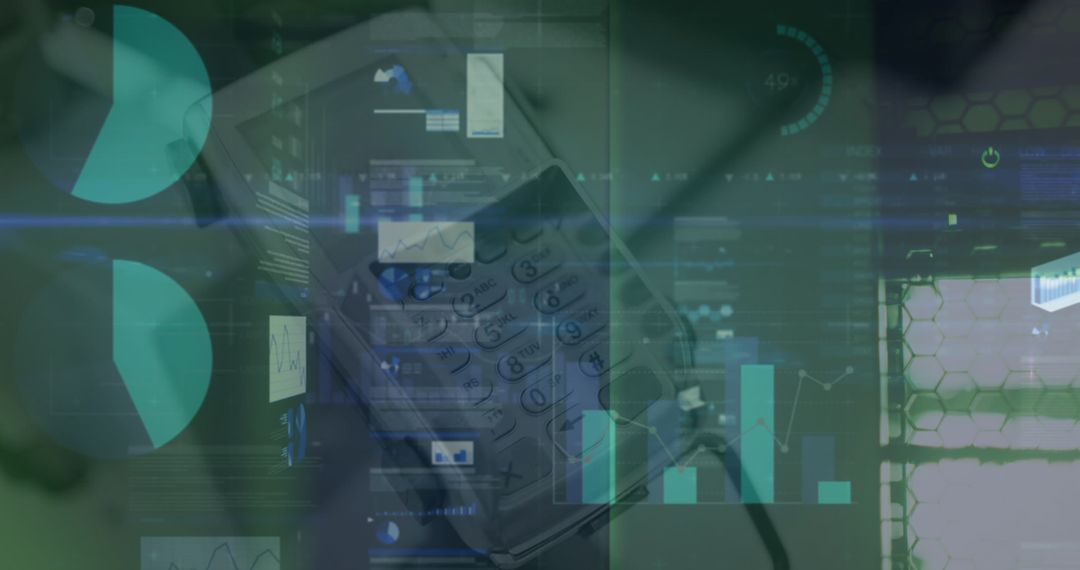
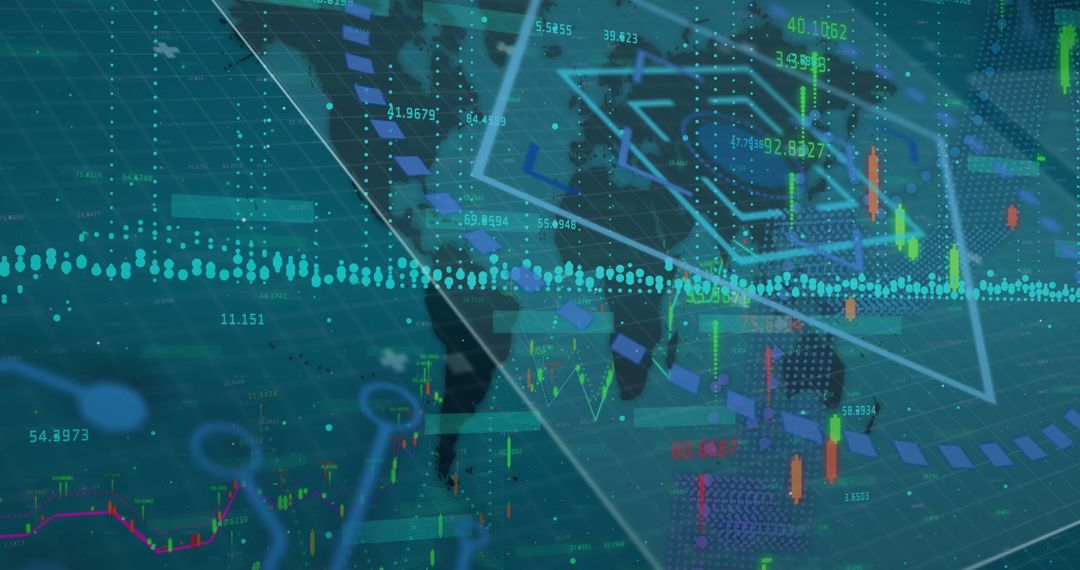
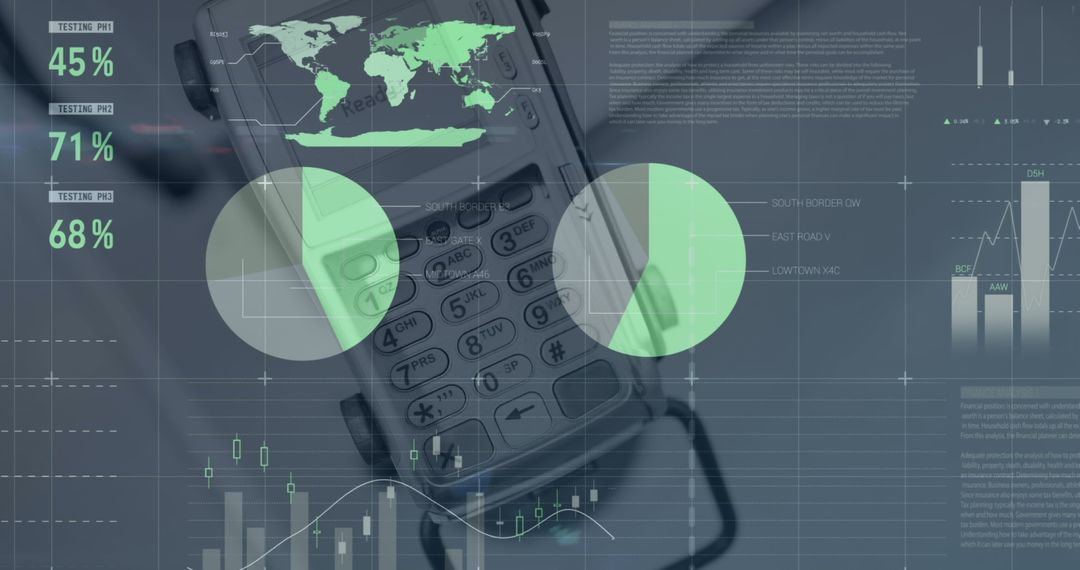
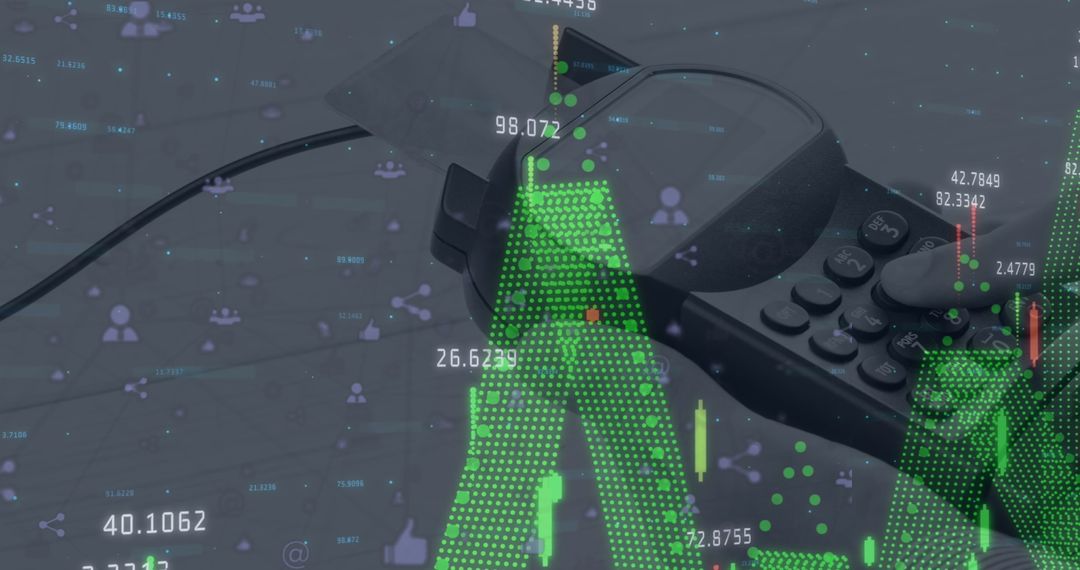
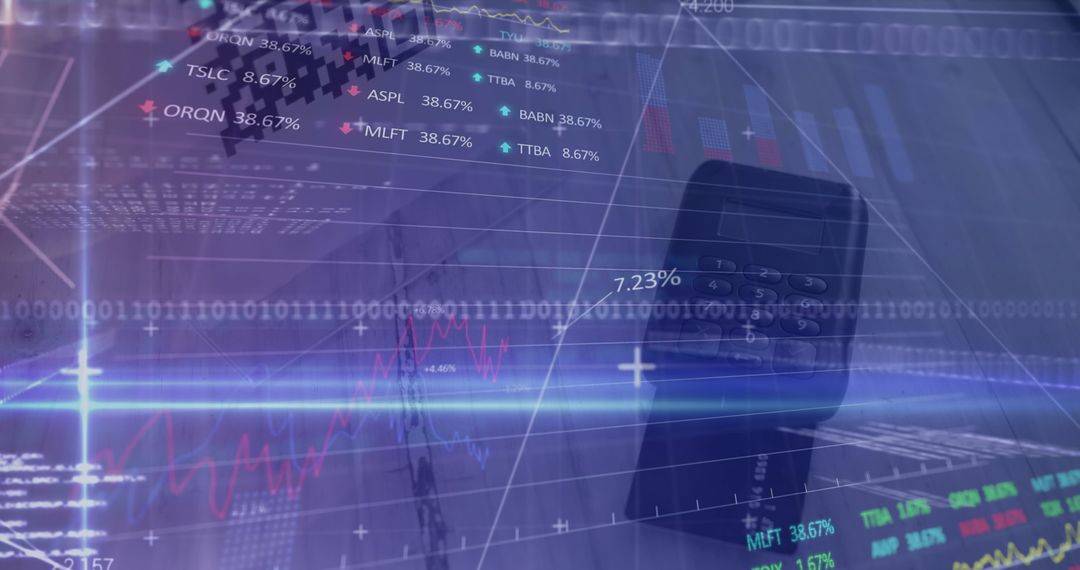
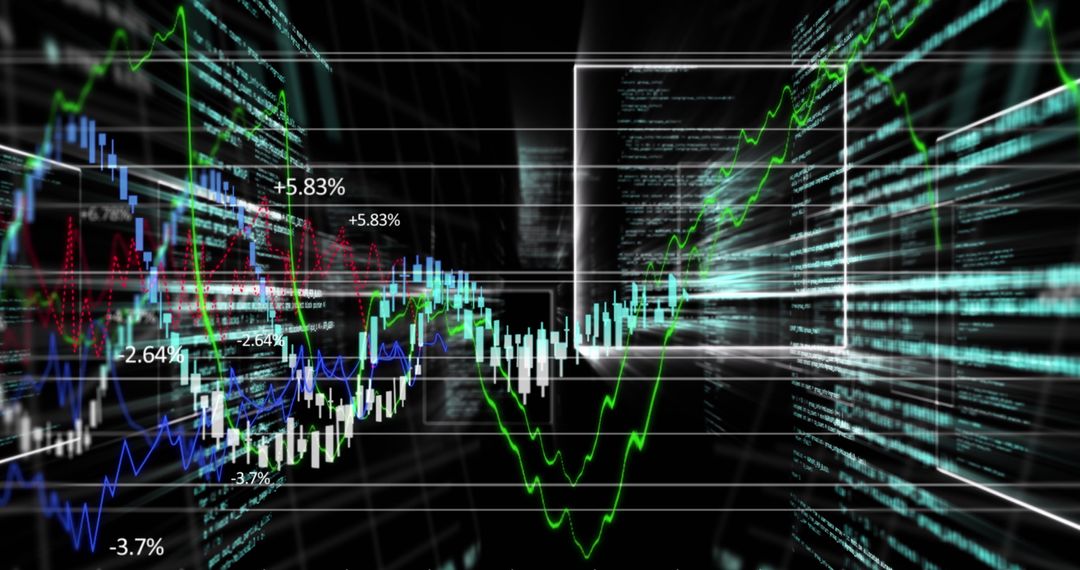
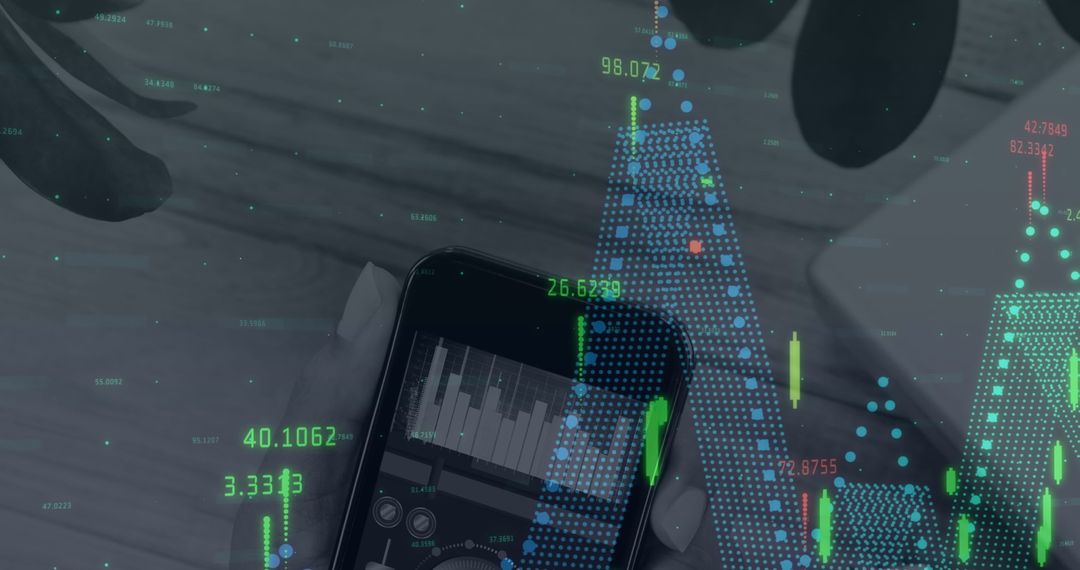
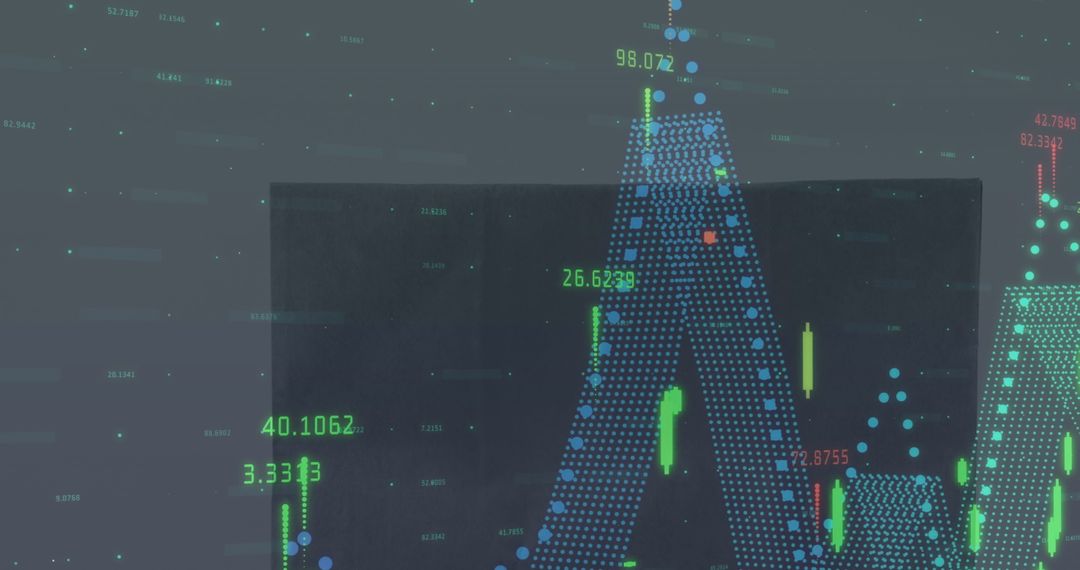
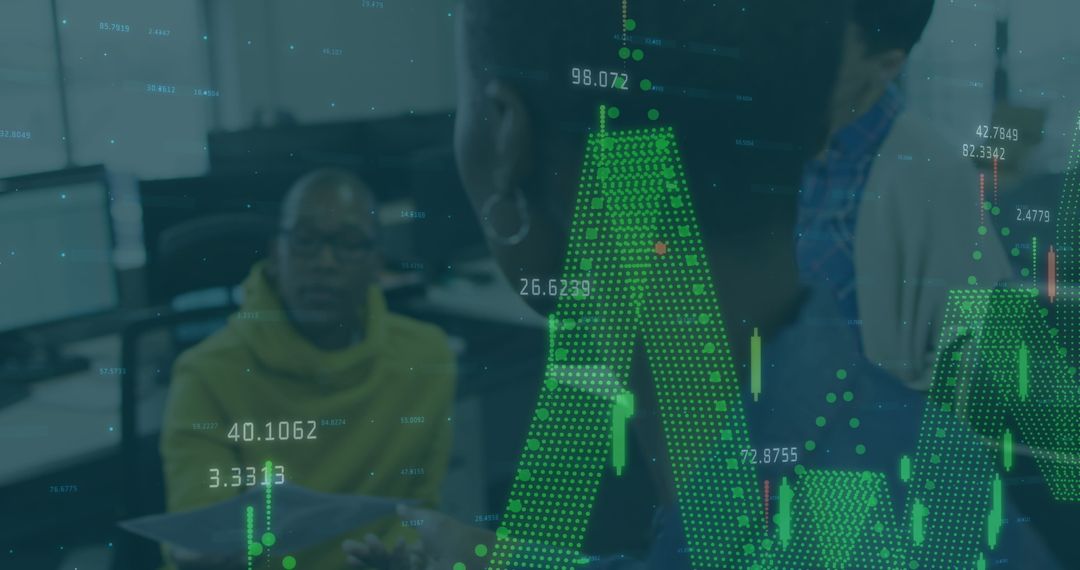
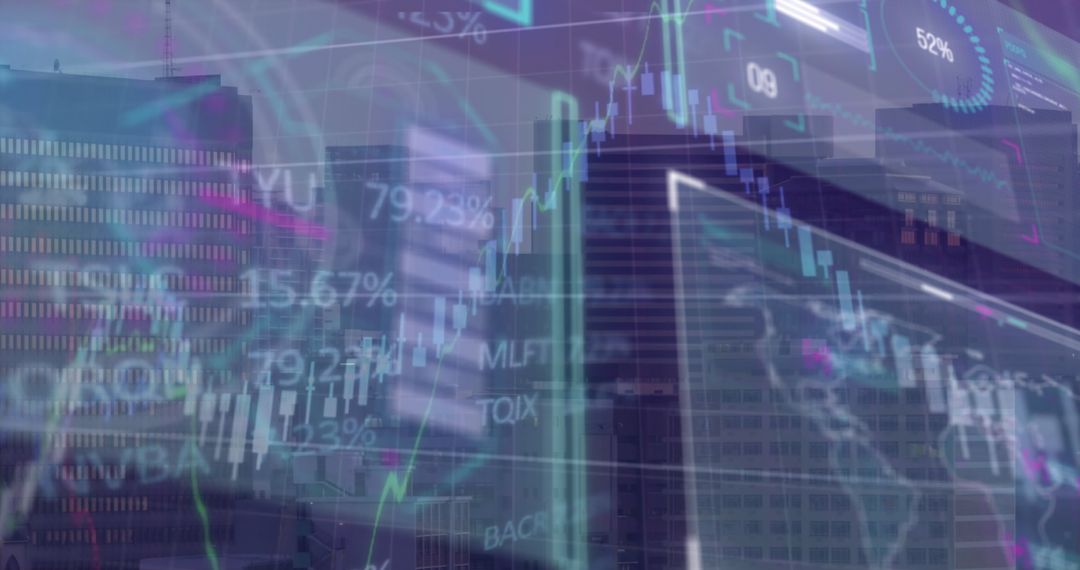
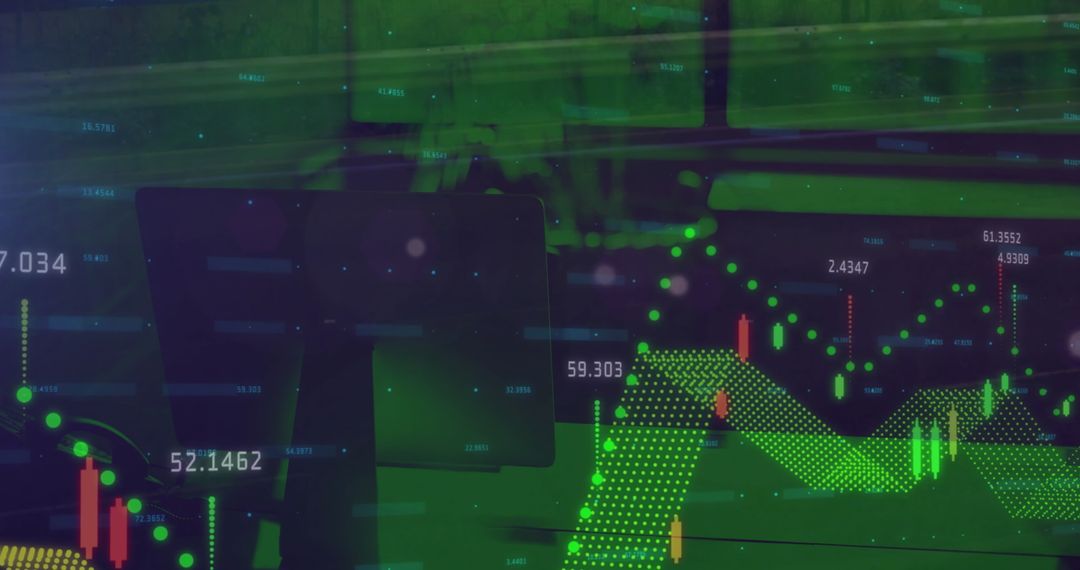
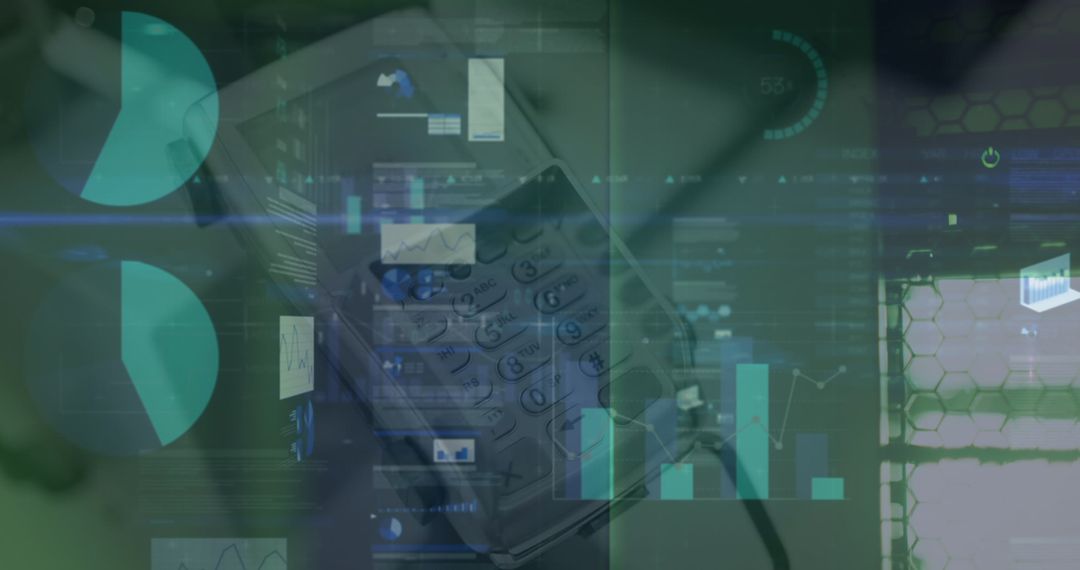
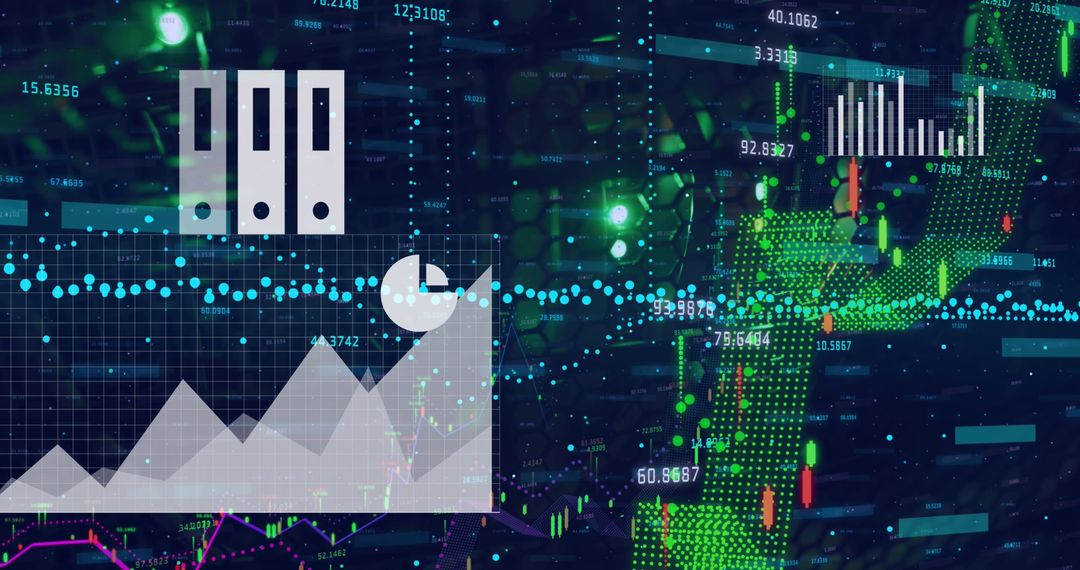
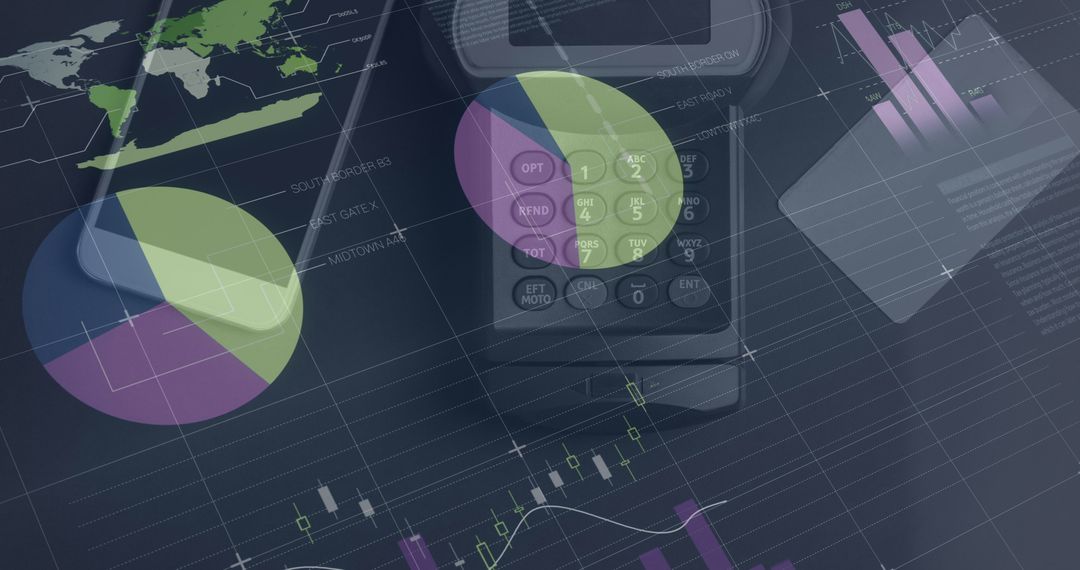
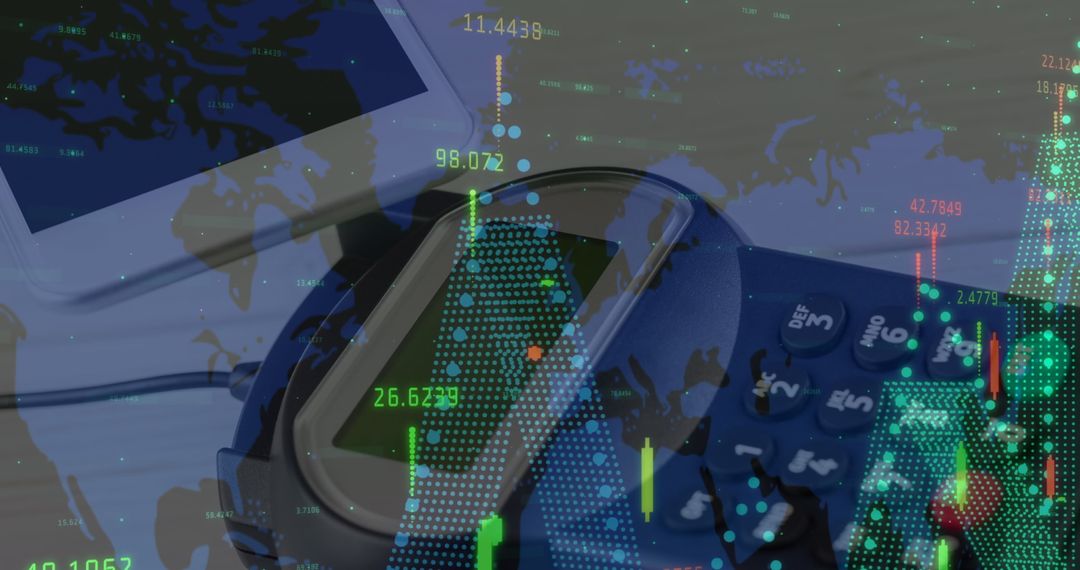
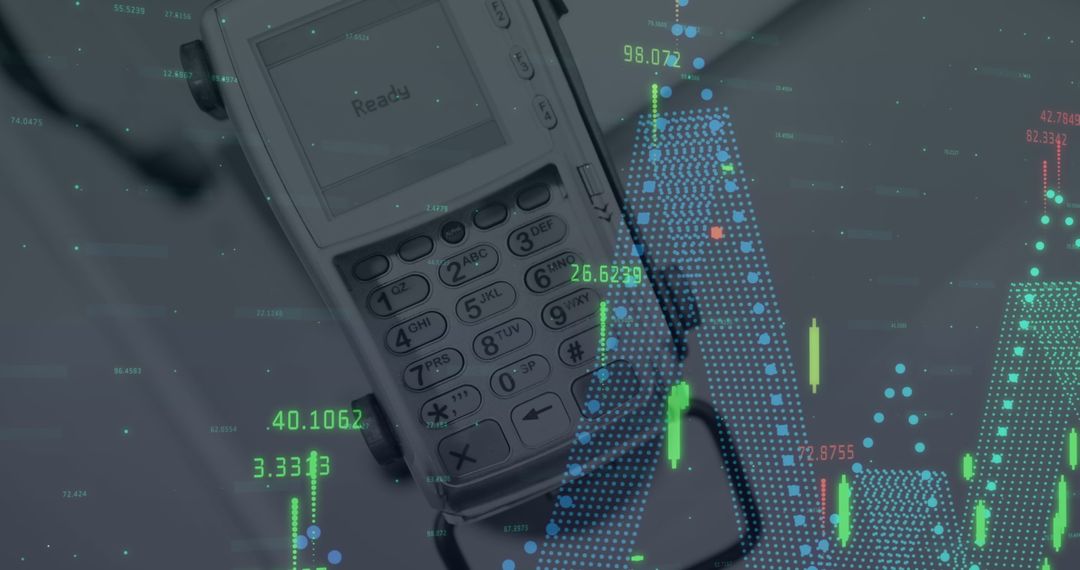
- Financial Analysis with Digital Candlestick Graph and Data Overlays
Financial Analysis with Digital Candlestick Graph and Data Overlays Image
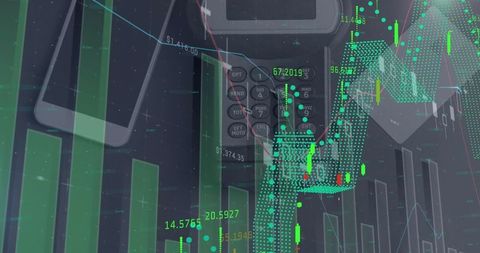
Merging technology with business analytics, this image emphasizes financial analysis through digital charts and data overlays. The combination of smartphone, calculators, and candlestick graphs evokes a sense of modern data-driven decision making. Ideal for representing corporate finance themes, stock market analysis, and economic trend demonstrations in business presentations, marketing materials, or tech articles focusing on financial investments.
Powered by 


2
downloads
downloads
Tags:
More
Credit Photo
If you would like to credit the Photo, here are some ways you can do so
Text Link
photo Link
<span class="text-link">
<span>
<a target="_blank" href=https://pikwizard.com/photo/financial-analysis-with-digital-candlestick-graph-and-data-overlays/7f586ab8a3a4626d4597b0d77c139268/>PikWizard</a>
</span>
</span>
<span class="image-link">
<span
style="margin: 0 0 20px 0; display: inline-block; vertical-align: middle; width: 100%;"
>
<a
target="_blank"
href="https://pikwizard.com/photo/financial-analysis-with-digital-candlestick-graph-and-data-overlays/7f586ab8a3a4626d4597b0d77c139268/"
style="text-decoration: none; font-size: 10px; margin: 0;"
>
<img src="https://pikwizard.com/pw/medium/7f586ab8a3a4626d4597b0d77c139268.jpg" style="margin: 0; width: 100%;" alt="" />
<p style="font-size: 12px; margin: 0;">PikWizard</p>
</a>
</span>
</span>
Free (free of charge)
Free for personal and commercial use.
Author: Awesome Content
Similar Free Stock Images
Premium

Premium


Premium


Premium


Premium


Premium


Premium

Premium


Premium


Premium


Premium

Premium


Premium


Premium


Premium


Premium


Premium


Premium


Premium


Premium


Premium

Premium


Premium


Premium