- Home >
- Stock Photos >
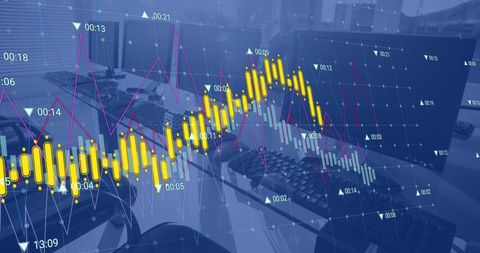
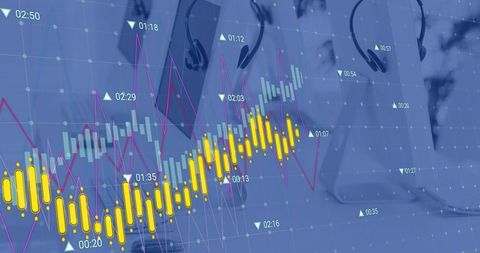
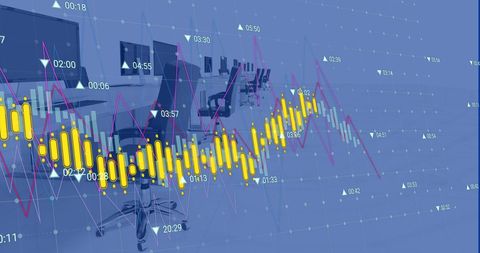
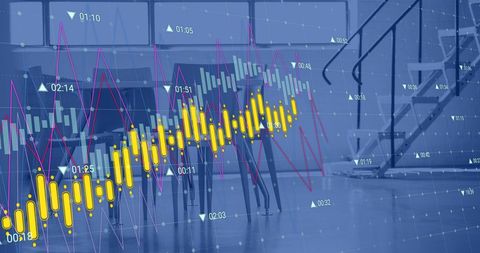
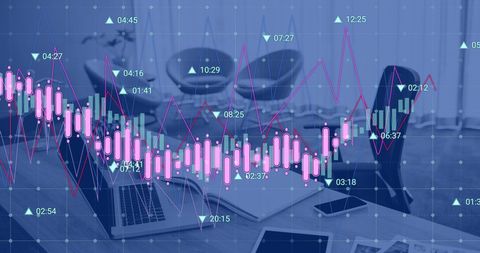
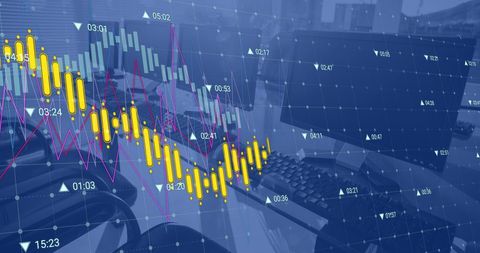
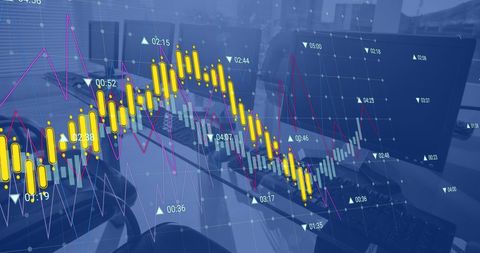
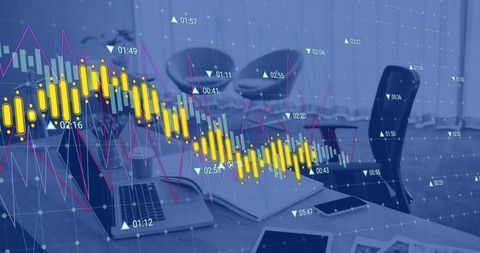
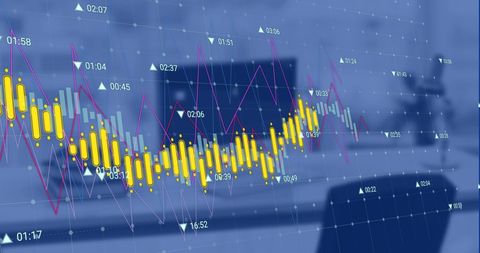
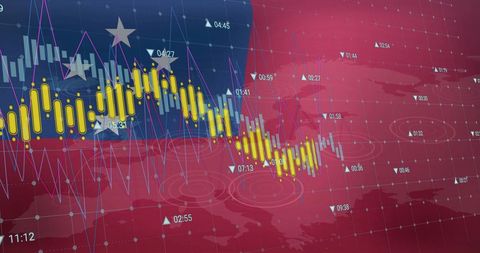
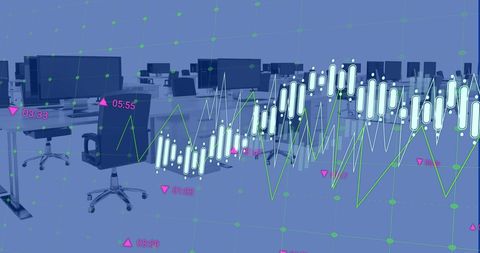
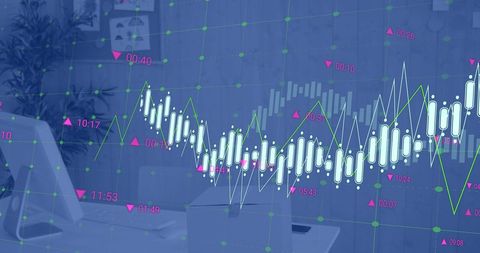
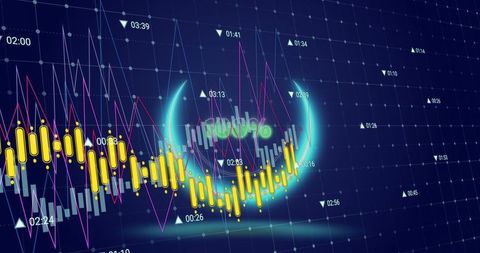
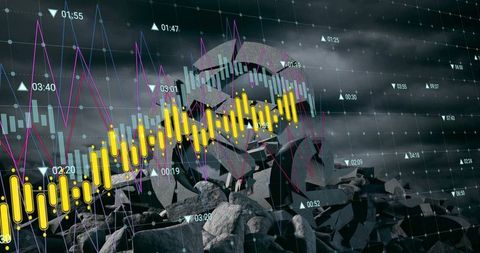
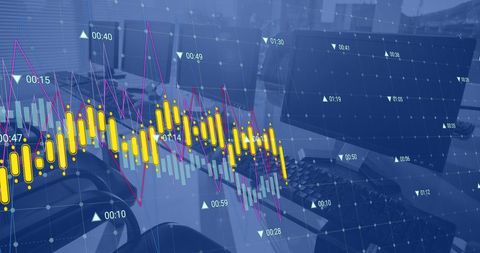
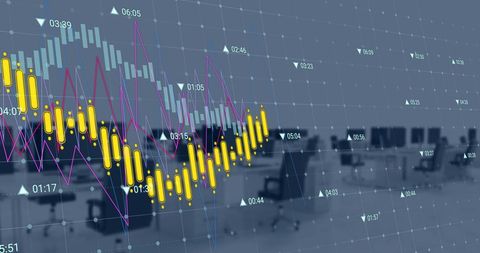
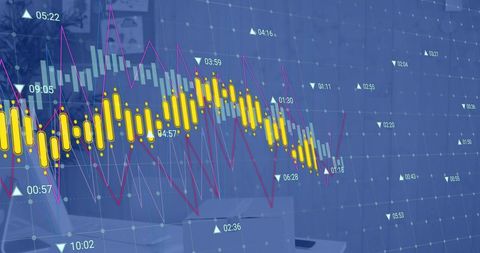
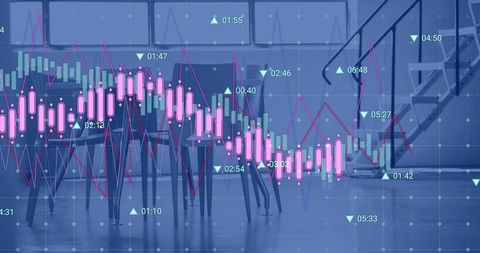
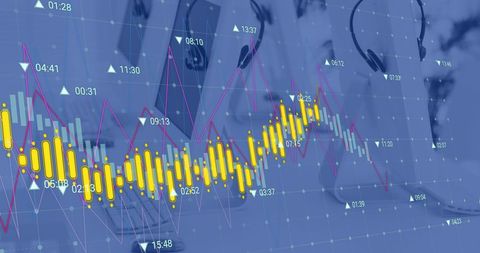
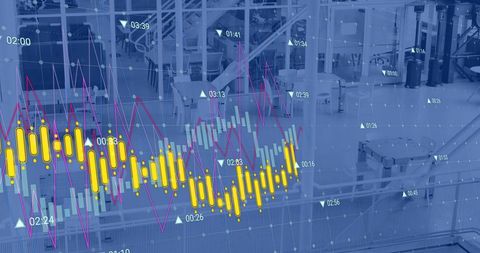
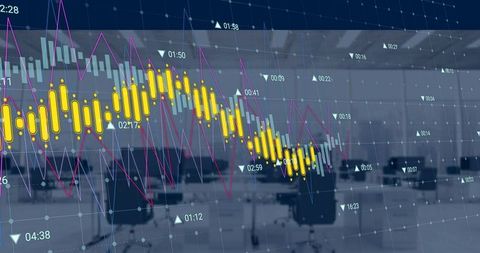
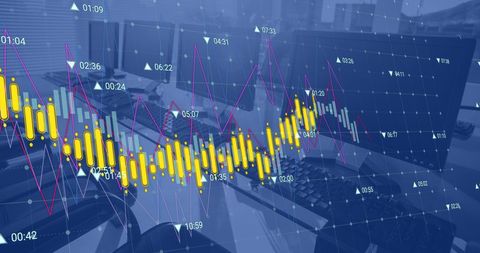
- Financial Analysis with Digital Data Visualization in Modern Workplace
Financial Analysis with Digital Data Visualization in Modern Workplace Image
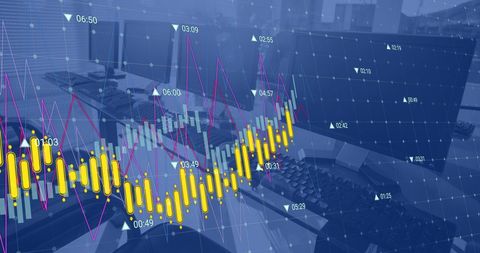
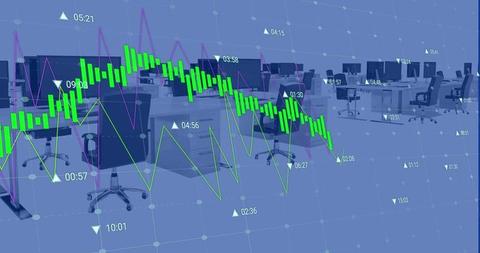
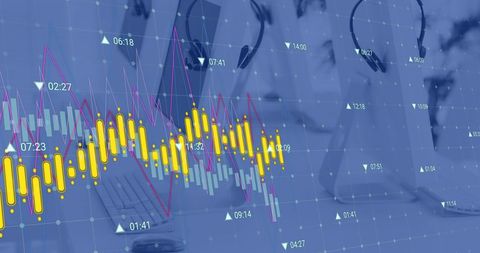
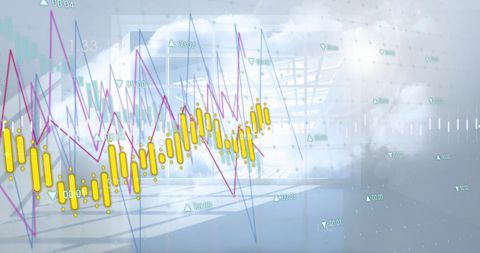
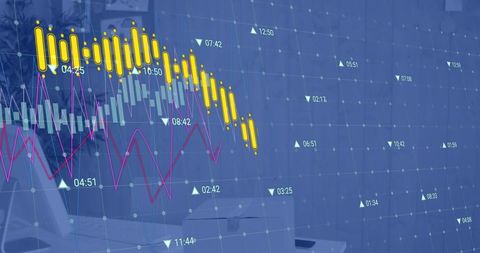
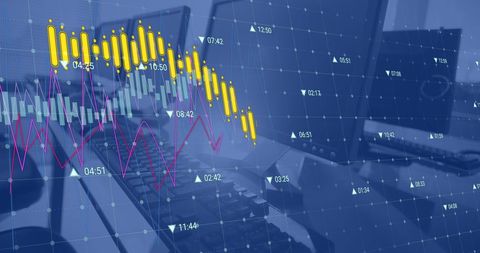
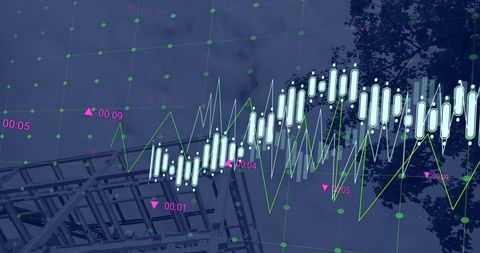
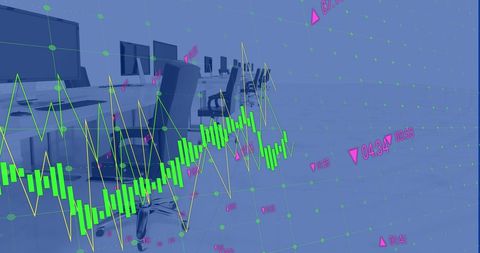
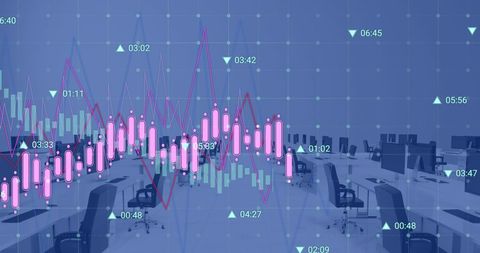
Illustrating financial analysis through data visualization, this scene presents a detailed overlay of stock market graphs and numbers set in a contemporary office environment. Yellow and pink lines indicate market trends rising upwards, potentially suggesting economic growth or trends analysis. Use this for publications about fintech, investment strategies, and business tech narratives. Suitable for newsletters, business presentations, or educational content on economic trends and stock market analytics.

downloads
Tags:
More
Credit Photo
If you would like to credit the Photo, here are some ways you can do so
Text Link
photo Link
<span class="text-link">
<span>
<a target="_blank" href=https://pikwizard.com/photo/financial-analysis-with-digital-data-visualization-in-modern-workplace/90f0565526d494eb246faa35df48d773/>PikWizard</a>
</span>
</span>
<span class="image-link">
<span
style="margin: 0 0 20px 0; display: inline-block; vertical-align: middle; width: 100%;"
>
<a
target="_blank"
href="https://pikwizard.com/photo/financial-analysis-with-digital-data-visualization-in-modern-workplace/90f0565526d494eb246faa35df48d773/"
style="text-decoration: none; font-size: 10px; margin: 0;"
>
<img src="https://pikwizard.com/pw/medium/90f0565526d494eb246faa35df48d773.jpg" style="margin: 0; width: 100%;" alt="" />
<p style="font-size: 12px; margin: 0;">PikWizard</p>
</a>
</span>
</span>
Free (free of charge)
Free for personal and commercial use.
Author: Authentic Images