
- Home >
- Stock Photos >
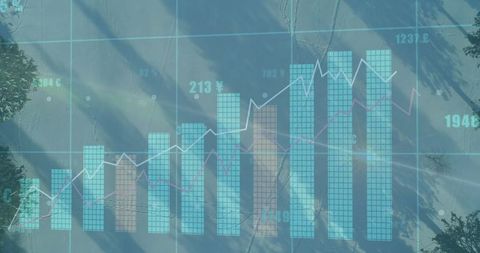
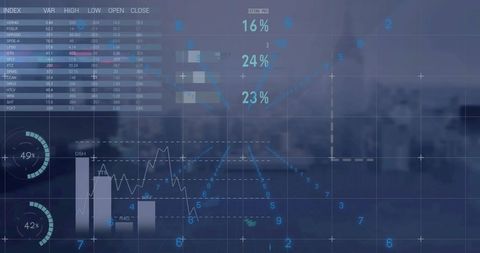
- Financial Analytics and Data Visualization on Digital Interface
Financial Analytics and Data Visualization on Digital Interface Image

Visual incorporation of financial graphs and statistics on a grid background highlights economic analysis. Suitable for conveying concepts of finance, market studies, and economic dynamics in educational content or finance-related media.
Powered by  - Get 15% off with code: PIKWIZARD15


downloads
Tags:
More
Credit Photo
If you would like to credit the Photo, here are some ways you can do so
Text Link
photo Link
<span class="text-link">
<span>
<a target="_blank" href=https://pikwizard.com/photo/financial-analytics-and-data-visualization-on-digital-interface/335edc292431756f5641f86d0ef44daf/>PikWizard</a>
</span>
</span>
<span class="image-link">
<span
style="margin: 0 0 20px 0; display: inline-block; vertical-align: middle; width: 100%;"
>
<a
target="_blank"
href="https://pikwizard.com/photo/financial-analytics-and-data-visualization-on-digital-interface/335edc292431756f5641f86d0ef44daf/"
style="text-decoration: none; font-size: 10px; margin: 0;"
>
<img src="https://pikwizard.com/pw/medium/335edc292431756f5641f86d0ef44daf.jpg" style="margin: 0; width: 100%;" alt="" />
<p style="font-size: 12px; margin: 0;">PikWizard</p>
</a>
</span>
</span>
Free (free of charge)
Free for personal and commercial use.
Author: Creative Art
Similar Free Stock Images

Premium


Premium

Premium


Premium


Premium


Premium

Premium


Premium

Premium


Premium


Premium


Premium


Premium


Premium


Premium


Premium


Premium


Premium

Premium


Premium


Premium


Premium

Premium


Premium


Premium

Explore More Free Stock Images