
- Home >
- Stock Photos >
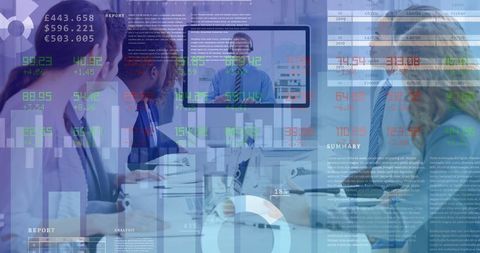
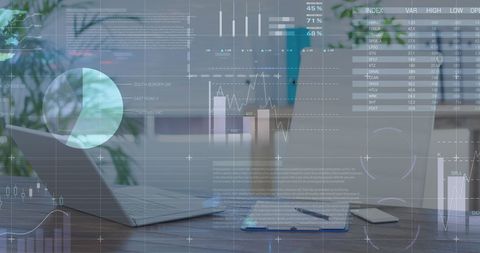
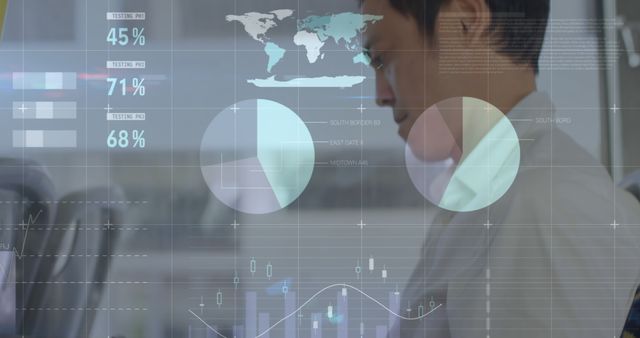
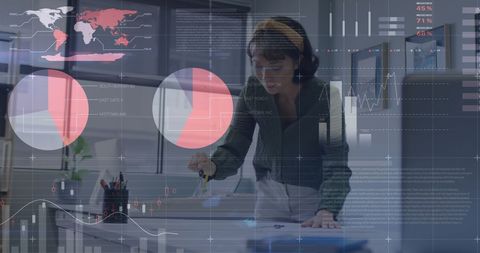
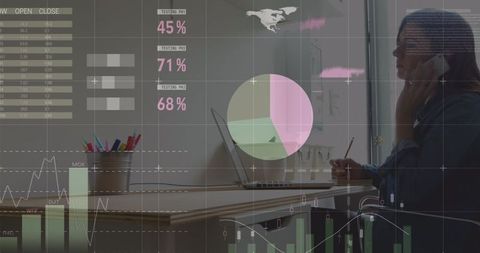
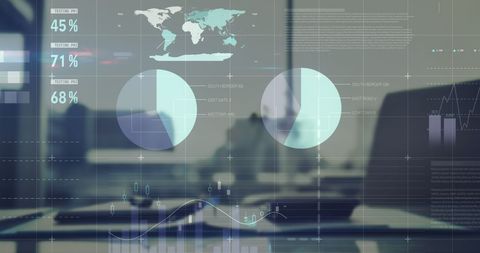
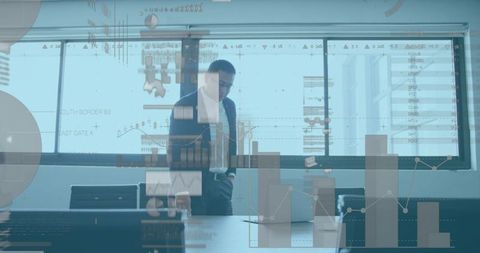
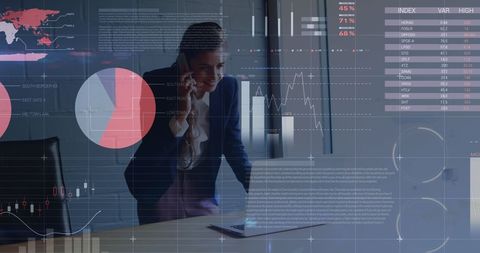
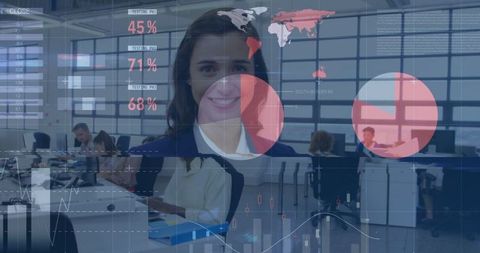
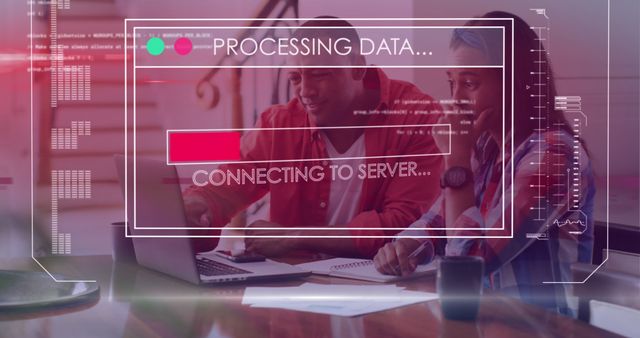
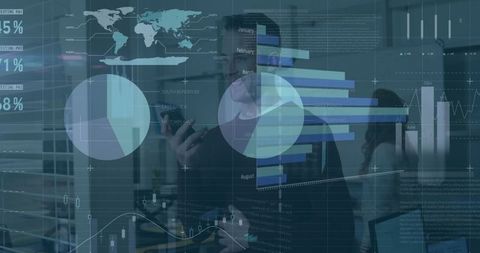
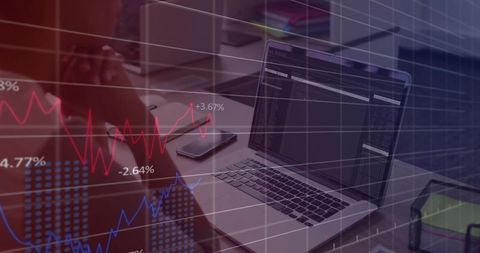
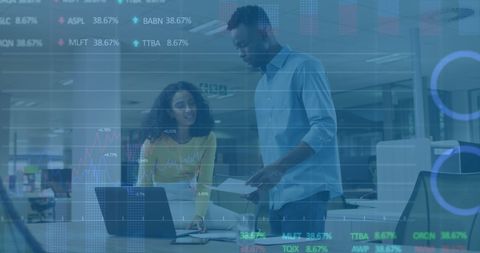
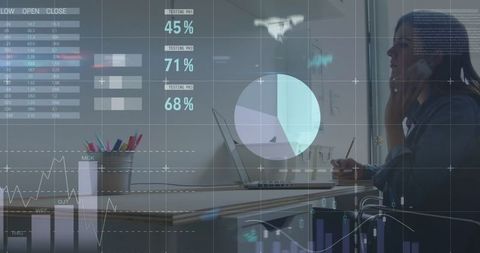
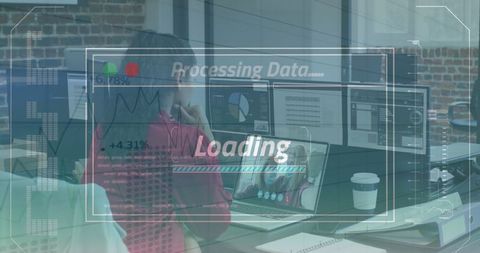
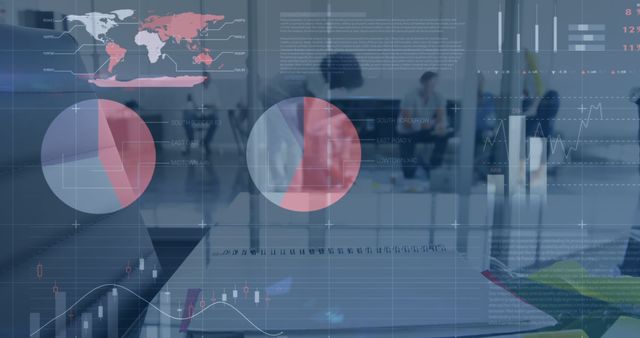
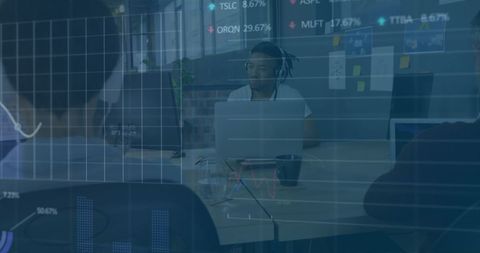
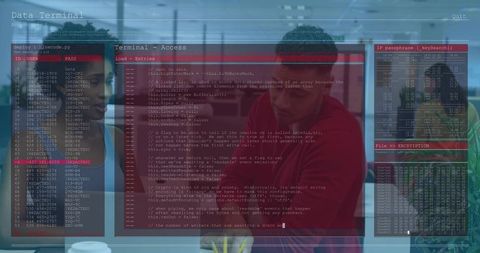
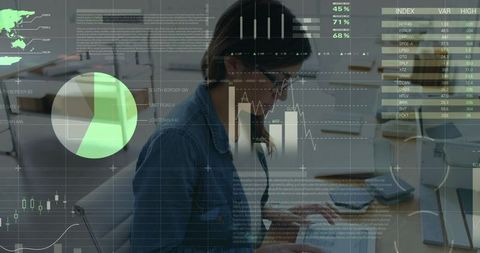
- Financial Analytics and Technology Merging
Financial Analytics and Technology Merging Image
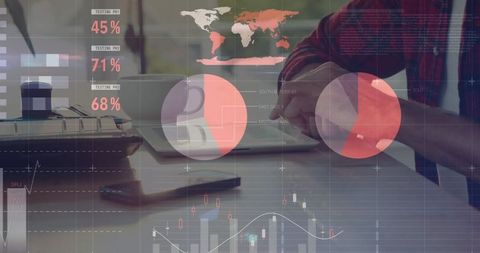
Financial data and charts overlaid on a seated person using a laptop depict the synergy between analytics and technology. Suitable for illustrating concepts in finance, economics, and technology sectors, perfect for educational content and reports on market trends or financial tools.
Powered by  - Get 15% off with code: PIKWIZARD15


downloads
Tags:
More
Credit Photo
If you would like to credit the Photo, here are some ways you can do so
Text Link
photo Link
<span class="text-link">
<span>
<a target="_blank" href=https://pikwizard.com/photo/financial-analytics-and-technology-merging/08b75a5760e68785f3959e43f4c0697c/>PikWizard</a>
</span>
</span>
<span class="image-link">
<span
style="margin: 0 0 20px 0; display: inline-block; vertical-align: middle; width: 100%;"
>
<a
target="_blank"
href="https://pikwizard.com/photo/financial-analytics-and-technology-merging/08b75a5760e68785f3959e43f4c0697c/"
style="text-decoration: none; font-size: 10px; margin: 0;"
>
<img src="https://pikwizard.com/pw/medium/08b75a5760e68785f3959e43f4c0697c.jpg" style="margin: 0; width: 100%;" alt="" />
<p style="font-size: 12px; margin: 0;">PikWizard</p>
</a>
</span>
</span>
Free (free of charge)
Free for personal and commercial use.
Author: Authentic Images
Similar Free Stock Images
Premium

Premium


Premium

Premium


Premium


Premium


Premium

Premium


Premium


Premium


Premium

Premium


Premium

Premium


Premium

Premium


Premium


Premium


Premium


Premium


Premium

Premium


Premium

Premium


Premium

Explore More Free Stock Images