- Home >
- Stock Photos >
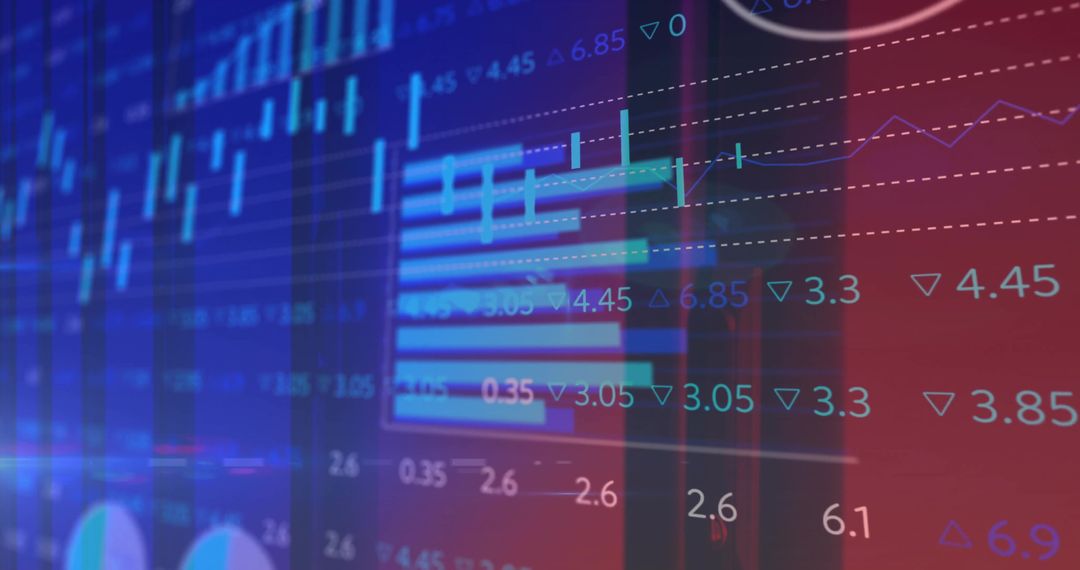
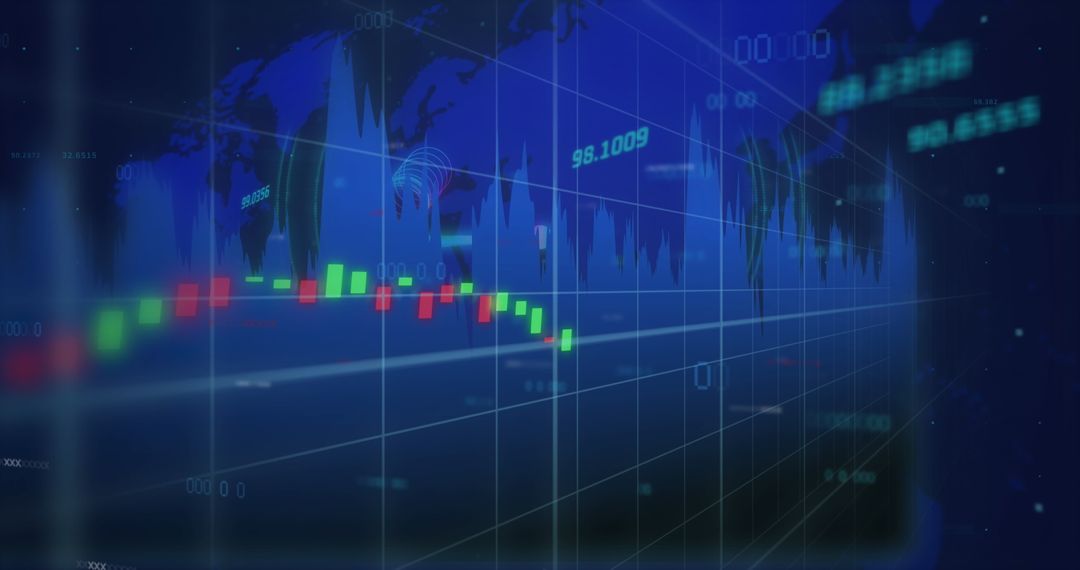
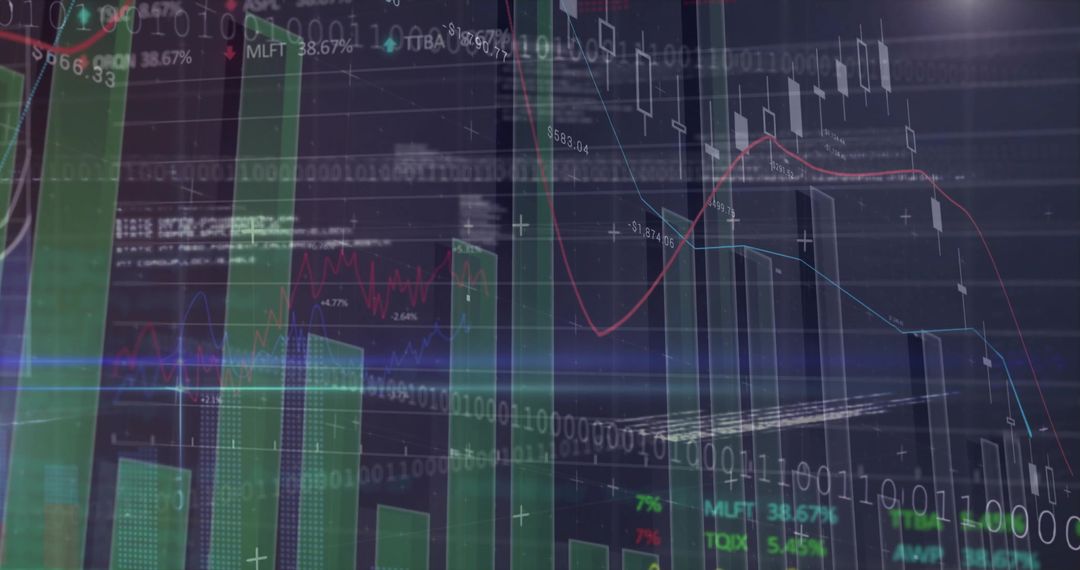
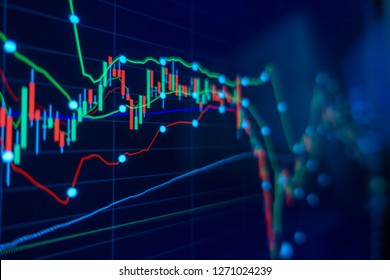
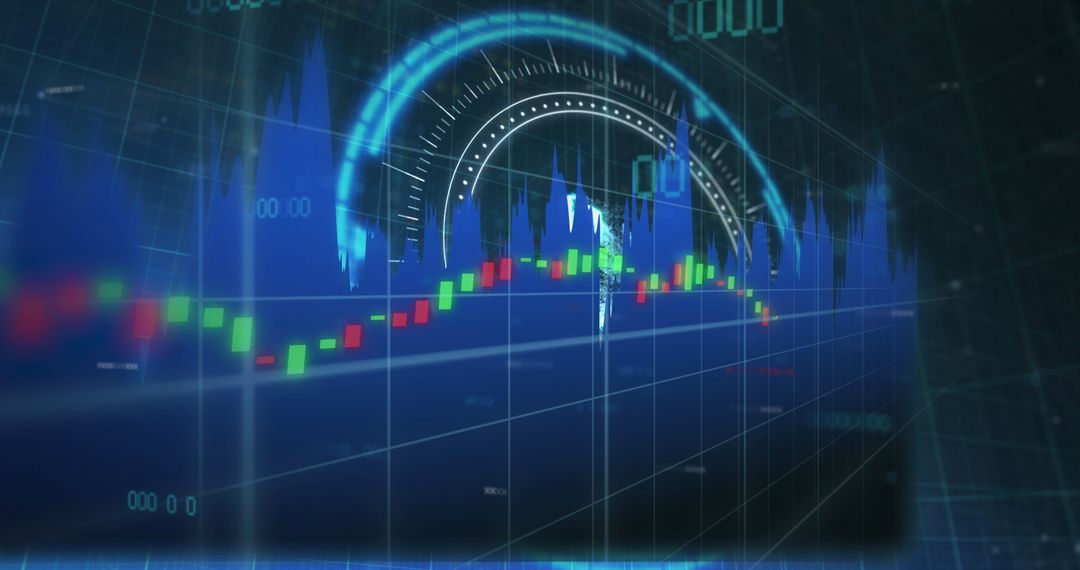
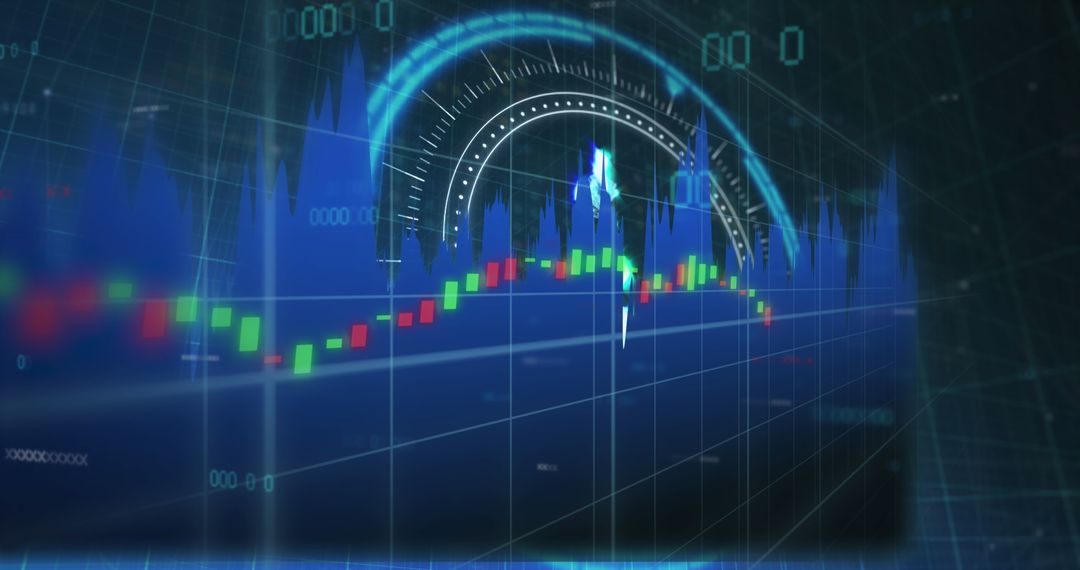
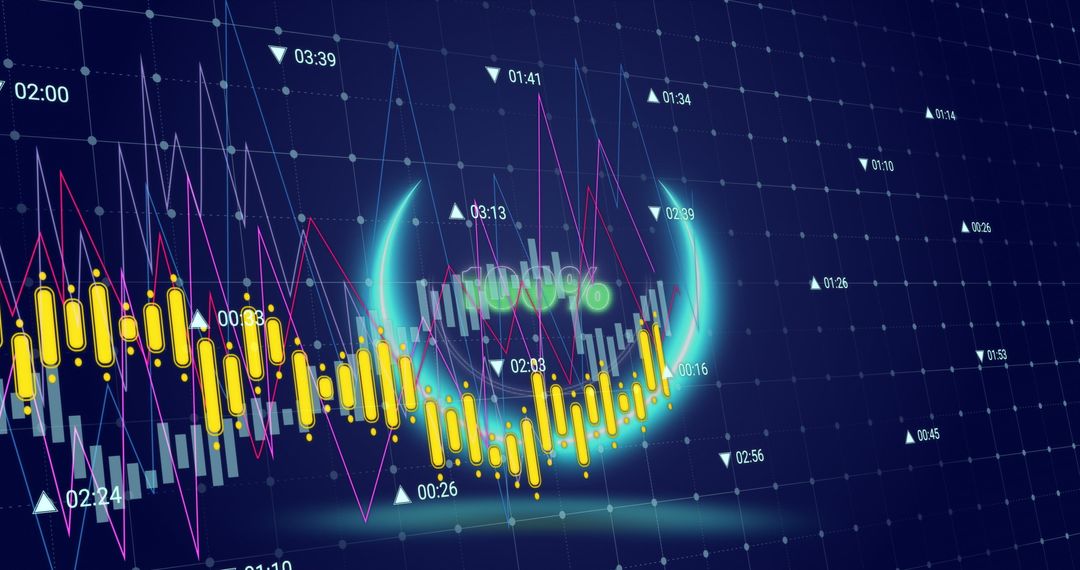
- Financial Analytics Concept with Candlestick Charts and Trend Lines
Financial Analytics Concept with Candlestick Charts and Trend Lines Image

Depicts financial chart with candlestick patterns, offering insight into stock market data. Useful for presentations or articles on finance, investment analysis, quantitative research, or economic trends. Enhances content on market performance and digital analytics.
Powered by  - Get 15% off with code: PIKWIZARD15


2
downloads
downloads
Tags:
More
Credit Photo
If you would like to credit the Photo, here are some ways you can do so
Text Link
photo Link
<span class="text-link">
<span>
<a target="_blank" href=https://pikwizard.com/photo/financial-analytics-concept-with-candlestick-charts-and-trend-lines/df1e0c0d60a61bd09e113b0c0b662b3c/>PikWizard</a>
</span>
</span>
<span class="image-link">
<span
style="margin: 0 0 20px 0; display: inline-block; vertical-align: middle; width: 100%;"
>
<a
target="_blank"
href="https://pikwizard.com/photo/financial-analytics-concept-with-candlestick-charts-and-trend-lines/df1e0c0d60a61bd09e113b0c0b662b3c/"
style="text-decoration: none; font-size: 10px; margin: 0;"
>
<img src="https://pikwizard.com/pw/medium/df1e0c0d60a61bd09e113b0c0b662b3c.jpg" style="margin: 0; width: 100%;" alt="" />
<p style="font-size: 12px; margin: 0;">PikWizard</p>
</a>
</span>
</span>
Free (free of charge)
Free for personal and commercial use.
Author: People Creations
Similar Free Stock Images

Premium


Premium


Premium


Premium


Premium


Premium


Premium


Premium


Premium


Premium


Premium


Premium


Premium


Premium


Premium


Premium


Premium


Premium


Premium


Premium


Premium


Premium


Premium


Premium