- Home >
- Stock Photos >
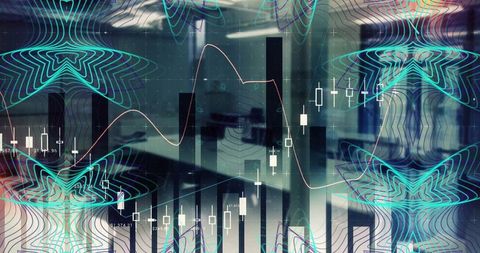
- Financial analytics dashboard overlaying modern open-plan office with candlestick charts
Financial analytics dashboard overlaying modern open-plan office with candlestick charts Image

Showing double-exposure composition combining candlestick charts, bar histogram and smooth trendlines over open-plan office background. Suiting corporate finance presentations, trading platform interfaces, fintech landing pages, investor reports and business analytics articles. Colors featuring deep blues, cyan highlights and subtle red indicators for profit/loss emphasis. Composition leaving space for overlaying headlines, logos and data callouts. Usage ideas: hero banner for finance website, background for investor pitch deck, header for market analysis blog, brochure cover for investment services, slide visuals for earnings calls. Suggesting licensing for commercial use, editorial use, incorporation into UI prototypes and app mockups.
Powered by 


downloads
Tags:
More
Credit Photo
If you would like to credit the Photo, here are some ways you can do so
Text Link
photo Link
<span class="text-link">
<span>
<a target="_blank" href=https://pikwizard.com/photo/financial-analytics-dashboard-overlaying-modern-open-plan-office-with-candlestick-charts/104612fb1ca76007adedf59518562d86/>PikWizard</a>
</span>
</span>
<span class="image-link">
<span
style="margin: 0 0 20px 0; display: inline-block; vertical-align: middle; width: 100%;"
>
<a
target="_blank"
href="https://pikwizard.com/photo/financial-analytics-dashboard-overlaying-modern-open-plan-office-with-candlestick-charts/104612fb1ca76007adedf59518562d86/"
style="text-decoration: none; font-size: 10px; margin: 0;"
>
<img src="https://pikwizard.com/pw/medium/104612fb1ca76007adedf59518562d86.jpg" style="margin: 0; width: 100%;" alt="" />
<p style="font-size: 12px; margin: 0;">PikWizard</p>
</a>
</span>
</span>
Free (free of charge)
Free for personal and commercial use.
Author: Creative Art
Similar Free Stock Images
Loading...

Premium


Premium

Premium


Premium


Premium


Premium

Premium


Premium


Premium

Premium

Premium


Premium


Premium


Premium


Premium


Premium

Premium

Premium

Premium


Premium


Premium


Premium

Premium


Premium


Premium