- Home >
- Stock Photos >
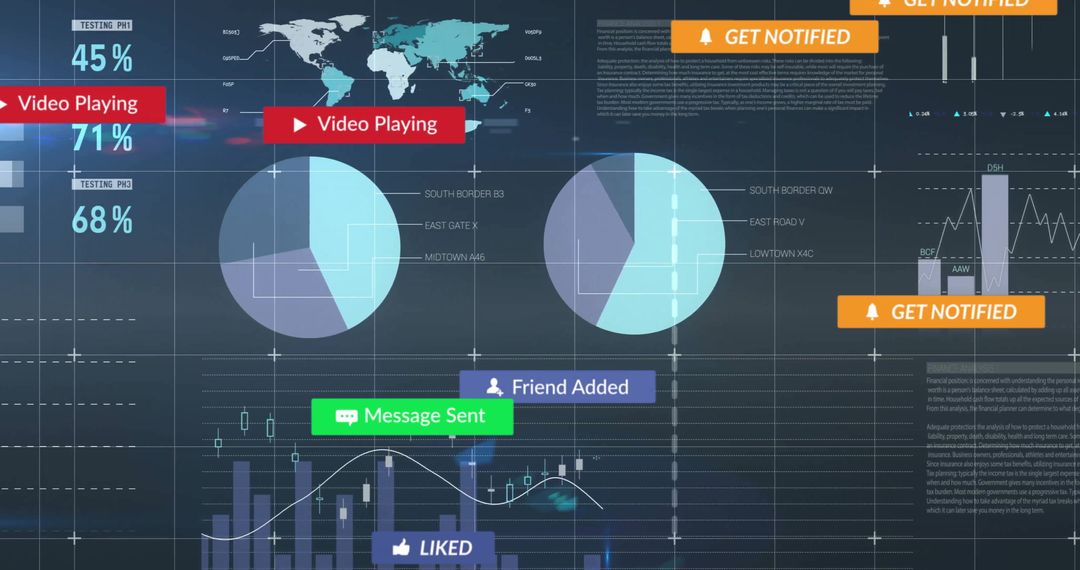
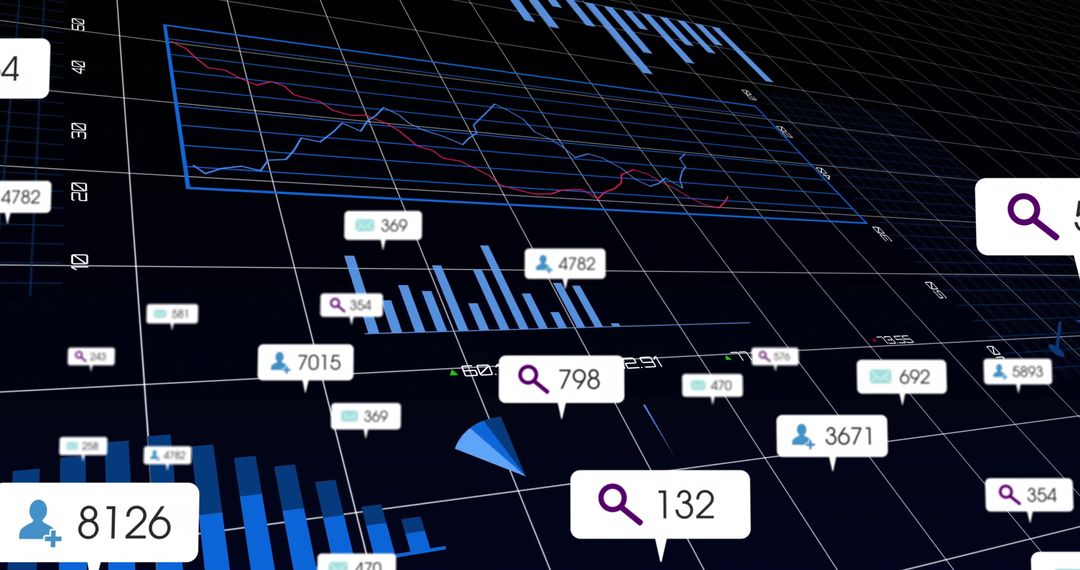
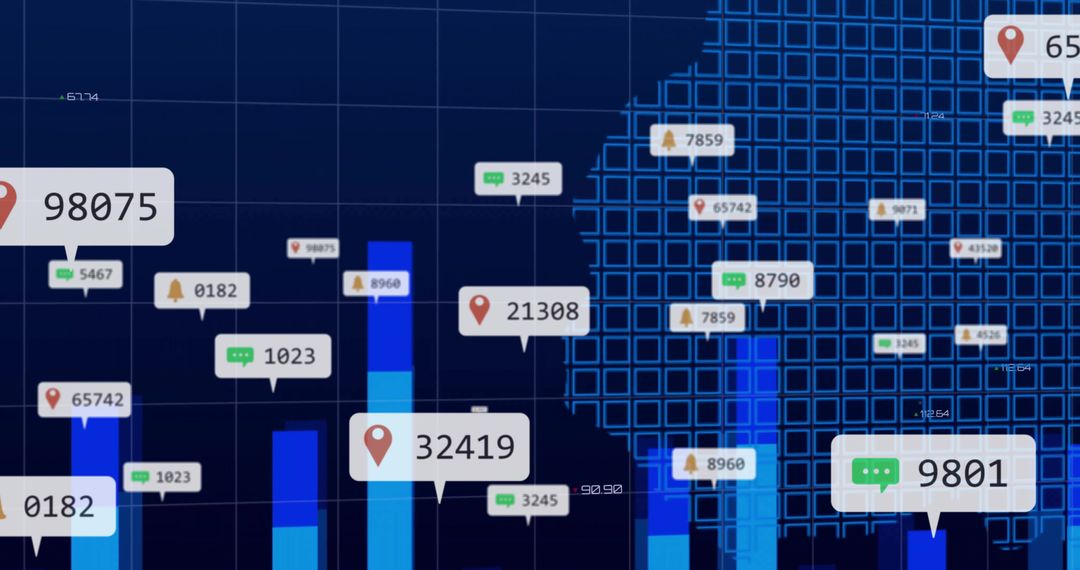
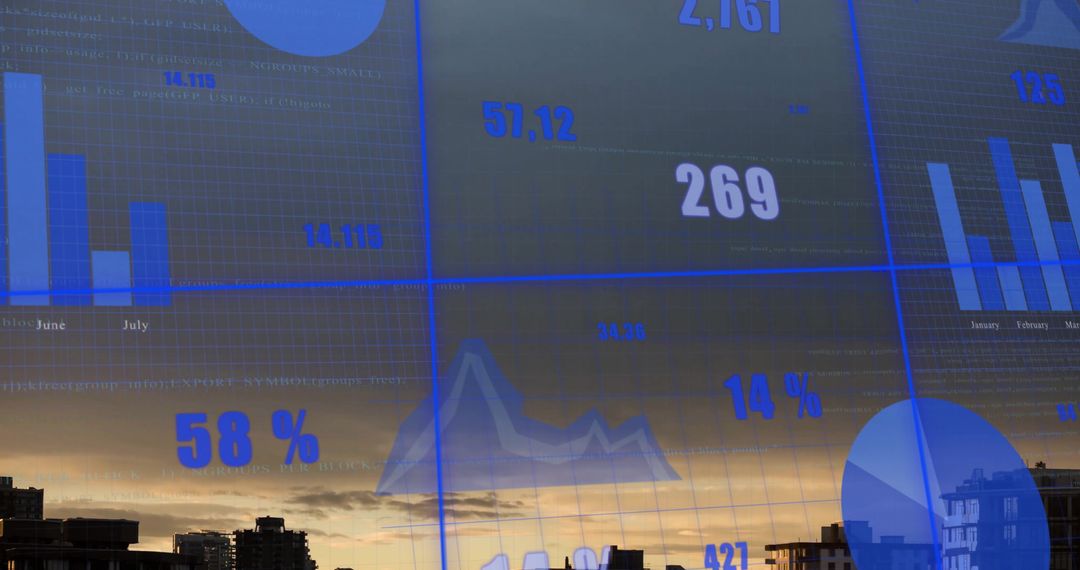
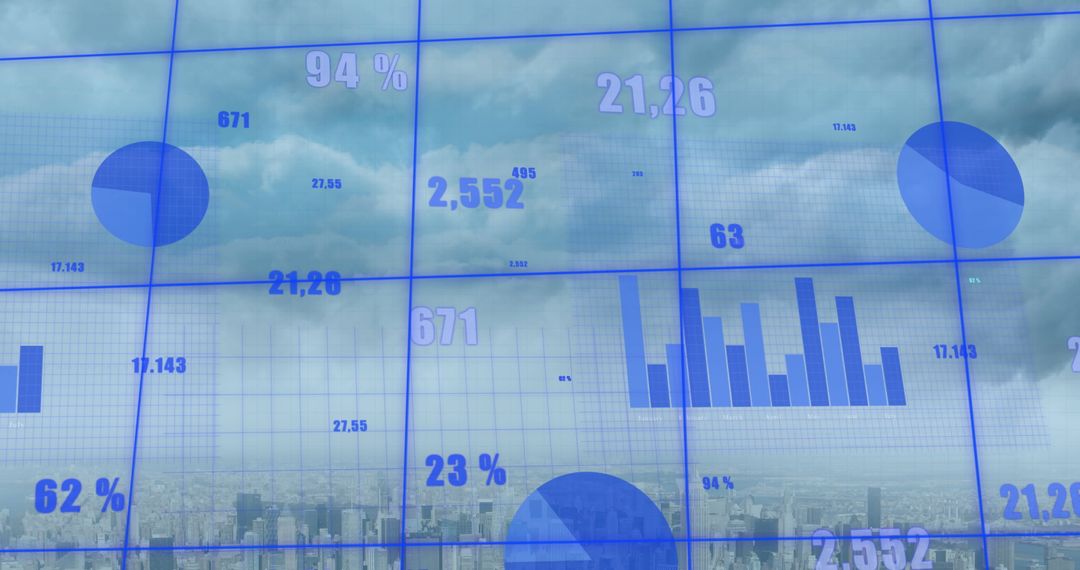
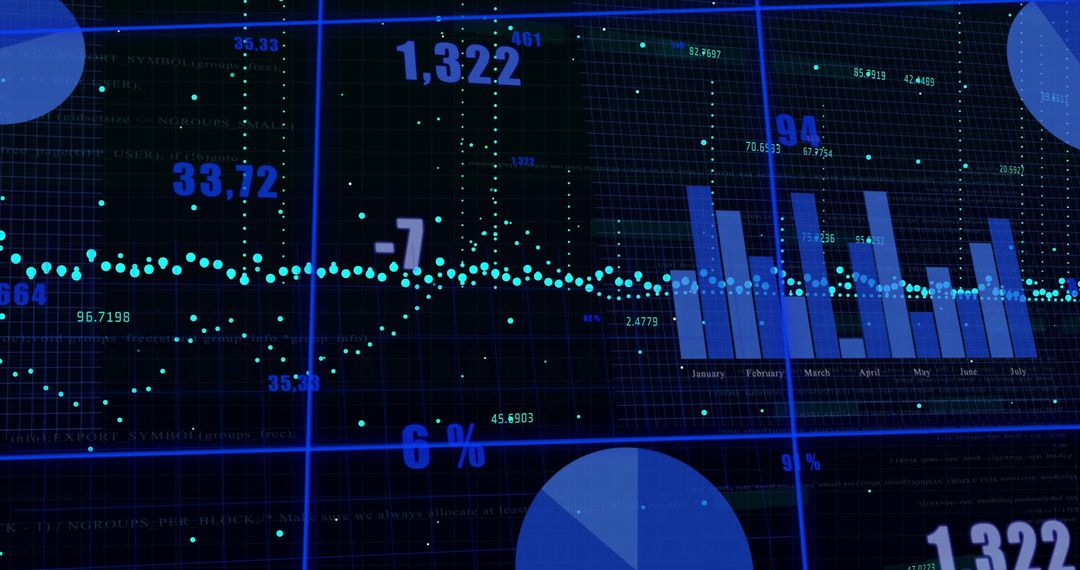
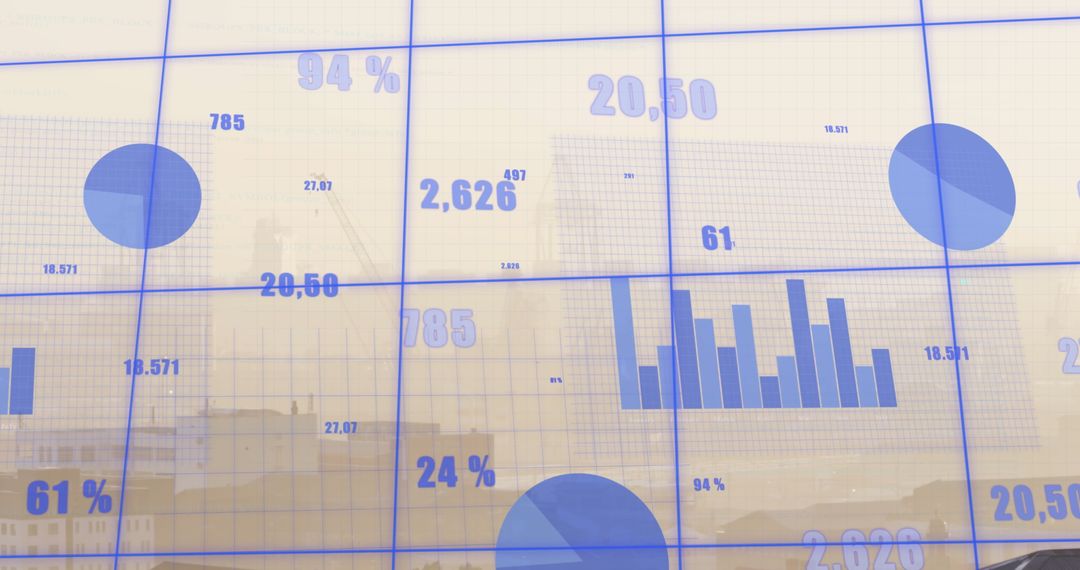
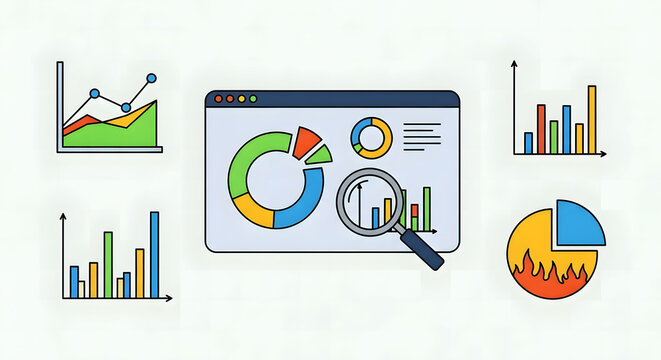
- Financial Analytics Dashboard with Charts and User Insights
Financial Analytics Dashboard with Charts and User Insights Image
Concept of financial and business data analytics displaying entwined grids, bar and pie charts. Red boxed user icons revealing demographic interchangeability in numeric data study centralizing digital finance. Ideal for articles or designs around technological finance strategies and the impact of digital insights in decision making. Useful for business presentations, educational content in econ and statistics, or standout impact illustrations engaging growth markets advancements to discuss and apply.
Powered by 


0
downloads
downloads
Tags:
More
Credit Photo
If you would like to credit the Photo, here are some ways you can do so
Text Link
photo Link
<span class="text-link">
<span>
<a target="_blank" href=https://pikwizard.com/photo/financial-analytics-dashboard-with-charts-and-user-insights/fb0681078271cab6f235436ec412d315/>PikWizard</a>
</span>
</span>
<span class="image-link">
<span
style="margin: 0 0 20px 0; display: inline-block; vertical-align: middle; width: 100%;"
>
<a
target="_blank"
href="https://pikwizard.com/photo/financial-analytics-dashboard-with-charts-and-user-insights/fb0681078271cab6f235436ec412d315/"
style="text-decoration: none; font-size: 10px; margin: 0;"
>
<img src="https://pikwizard.com/pw/medium/fb0681078271cab6f235436ec412d315.jpg" style="margin: 0; width: 100%;" alt="" />
<p style="font-size: 12px; margin: 0;">PikWizard</p>
</a>
</span>
</span>
Free (free of charge)
Free for personal and commercial use.
Author: Authentic Images
Similar Free Stock Images

Premium


Premium


Premium


Premium


Premium


Premium


Premium


Premium


Premium


Premium


Premium


Premium


Premium


Premium


Premium


Premium


Premium


Premium


Premium


Premium


Premium


Premium


Premium


Premium