
- Home >
- Stock Photos >
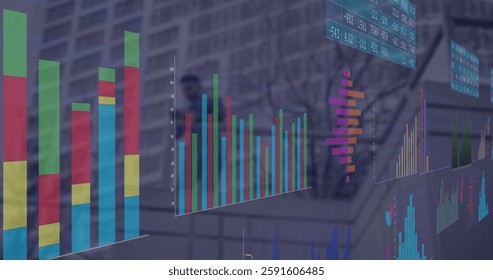
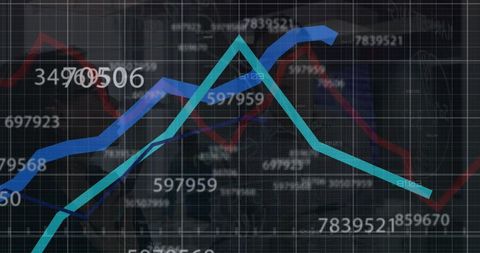
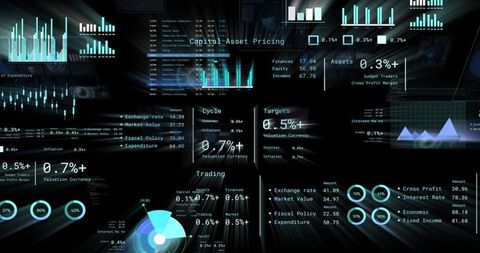
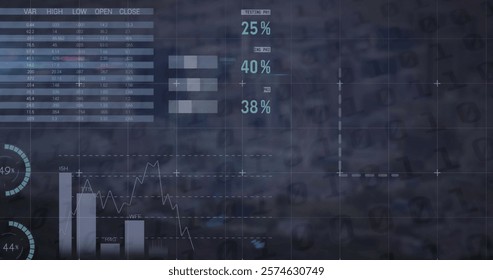
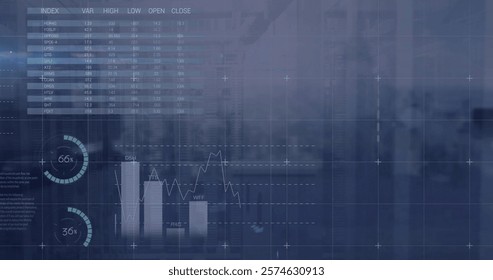
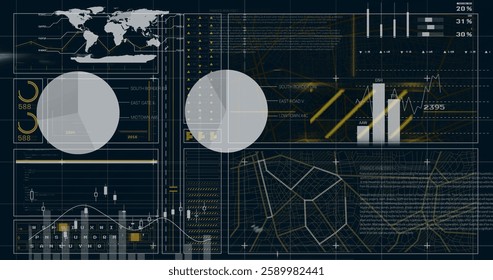
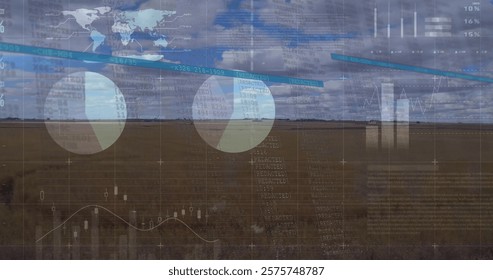
- Financial Analytics Dashboard with Global Market Data Visualization
Financial Analytics Dashboard with Global Market Data Visualization Image

This intricate visualization depicts a comprehensive financial analytics dashboard, showcasing bar charts combined with a line graph overlay on a digital world map. Ideal for illustrating concepts in financial analysis, global market monitoring, or corporate data management in presentations, reports, or educational materials. Useful for businesses in finance and trade sectors focusing on innovation through technology.
Powered by  - Get 15% off with code: PIKWIZARD15


downloads
Tags:
More
Credit Photo
If you would like to credit the Photo, here are some ways you can do so
Text Link
photo Link
<span class="text-link">
<span>
<a target="_blank" href=https://pikwizard.com/photo/financial-analytics-dashboard-with-global-market-data-visualization/e61b41821b8051fd9559ae27f906caa3/>PikWizard</a>
</span>
</span>
<span class="image-link">
<span
style="margin: 0 0 20px 0; display: inline-block; vertical-align: middle; width: 100%;"
>
<a
target="_blank"
href="https://pikwizard.com/photo/financial-analytics-dashboard-with-global-market-data-visualization/e61b41821b8051fd9559ae27f906caa3/"
style="text-decoration: none; font-size: 10px; margin: 0;"
>
<img src="https://pikwizard.com/pw/medium/e61b41821b8051fd9559ae27f906caa3.jpg" style="margin: 0; width: 100%;" alt="" />
<p style="font-size: 12px; margin: 0;">PikWizard</p>
</a>
</span>
</span>
Free (free of charge)
Free for personal and commercial use.
Author: Authentic Images
Similar Free Stock Images

Premium

Premium

Premium


Premium


Premium


Premium


Premium


Premium


Premium
Premium


Premium


Premium


Premium


Premium


Premium


Premium


Premium


Premium


Premium


Premium


Premium


Premium


Premium


Premium


Premium
Explore More Free Stock Images