
- Home >
- Stock Photos >
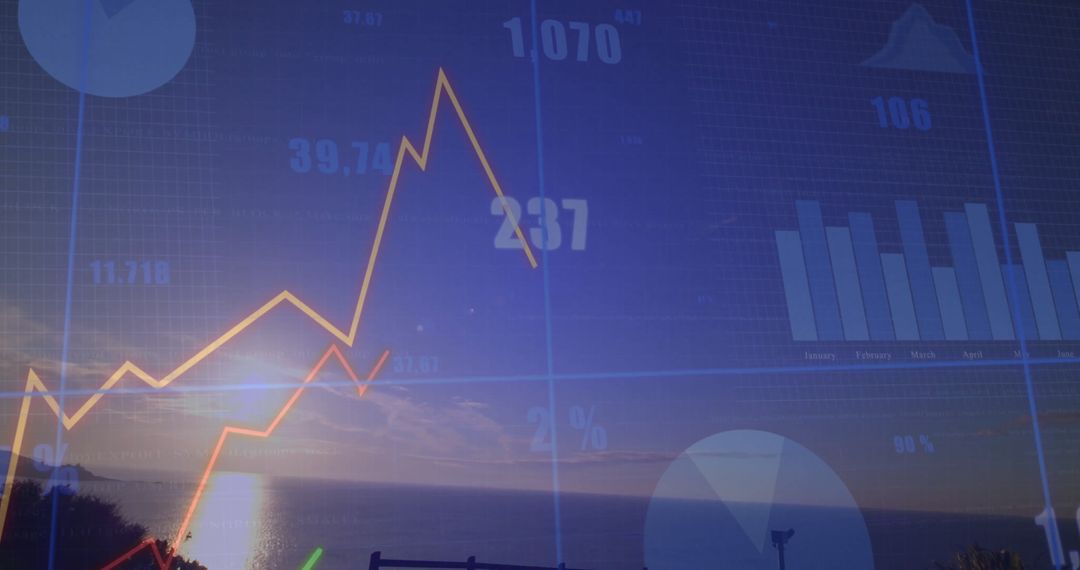
- Financial Analytics Dashboard with Rising Graph and Charts
Financial Analytics Dashboard with Rising Graph and Charts Image

This stock photo provides a compelling depiction of financial analytics through various charts and a prominent rising line graph. Ideal for illustrating concepts in business finance, economics, and data science, it can be strategically used in presentations, articles, and digital platforms focusing on market trends and data analysis. The image offers a professional blend of graphics suitable for training material, financial platform interfaces, and educational content on modern analytics.
Powered by 


0
downloads
downloads
Tags:
More
Credit Photo
If you would like to credit the Photo, here are some ways you can do so
Text Link
photo Link
<span class="text-link">
<span>
<a target="_blank" href=https://pikwizard.com/photo/financial-analytics-dashboard-with-rising-graph-and-charts/1d12cd82b63c59cf1b263534dd2fb09a/>PikWizard</a>
</span>
</span>
<span class="image-link">
<span
style="margin: 0 0 20px 0; display: inline-block; vertical-align: middle; width: 100%;"
>
<a
target="_blank"
href="https://pikwizard.com/photo/financial-analytics-dashboard-with-rising-graph-and-charts/1d12cd82b63c59cf1b263534dd2fb09a/"
style="text-decoration: none; font-size: 10px; margin: 0;"
>
<img src="https://pikwizard.com/pw/medium/1d12cd82b63c59cf1b263534dd2fb09a.jpg" style="margin: 0; width: 100%;" alt="" />
<p style="font-size: 12px; margin: 0;">PikWizard</p>
</a>
</span>
</span>
Free (free of charge)
Free for personal and commercial use.
Author: Creative Art
Similar Free Stock Images

Premium


Premium


Premium


Premium


Premium


Premium


Premium


Premium


Premium


Premium


Premium


Premium


Premium


Premium


Premium


Premium


Premium


Premium


Premium


Premium


Premium


Premium


Premium


Premium

