
- Home >
- Stock Photos >
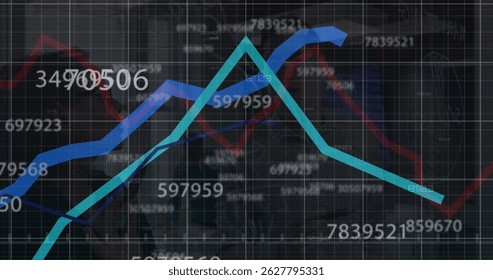
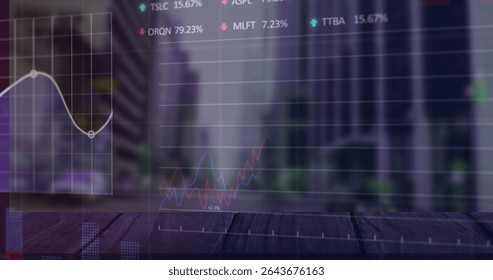
- Financial Analytics Dashboard with Trend Lines and Data Visualization
Financial Analytics Dashboard with Trend Lines and Data Visualization Image

This dynamic representation shows financial analytics interface, featuring white-frame candlesticks and a sine wave overlaid on a grid. Green trend line steers upwards, providing insight into investment strategies and market movements. Vector design of this digital dashboard suits use in business presentations, investment company media, and articles on economic trends. Effective for discussing market analysis or integrating tech-driven finance visuals into content.
Powered by  - Get 15% off with code: PIKWIZARD15


downloads
Tags:
More
Credit Photo
If you would like to credit the Photo, here are some ways you can do so
Text Link
photo Link
<span class="text-link">
<span>
<a target="_blank" href=https://pikwizard.com/photo/financial-analytics-dashboard-with-trend-lines-and-data-visualization/4dbb03f6c7a1b136738a0beb03b4a0c7/>PikWizard</a>
</span>
</span>
<span class="image-link">
<span
style="margin: 0 0 20px 0; display: inline-block; vertical-align: middle; width: 100%;"
>
<a
target="_blank"
href="https://pikwizard.com/photo/financial-analytics-dashboard-with-trend-lines-and-data-visualization/4dbb03f6c7a1b136738a0beb03b4a0c7/"
style="text-decoration: none; font-size: 10px; margin: 0;"
>
<img src="https://pikwizard.com/pw/medium/4dbb03f6c7a1b136738a0beb03b4a0c7.jpg" style="margin: 0; width: 100%;" alt="" />
<p style="font-size: 12px; margin: 0;">PikWizard</p>
</a>
</span>
</span>
Free (free of charge)
Free for personal and commercial use.
Author: People Creations


