- Home >
- Stock Photos >
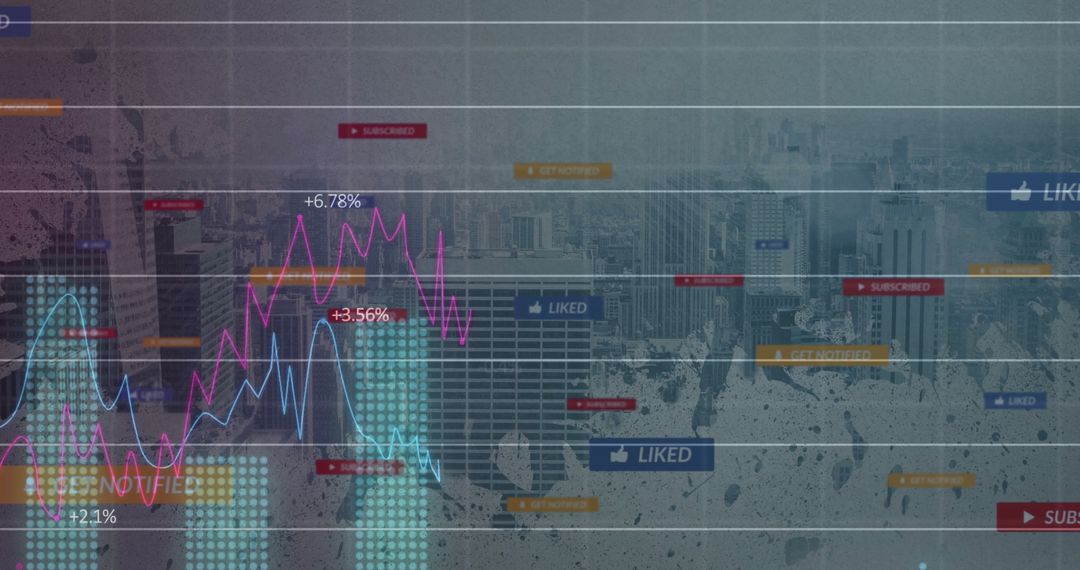
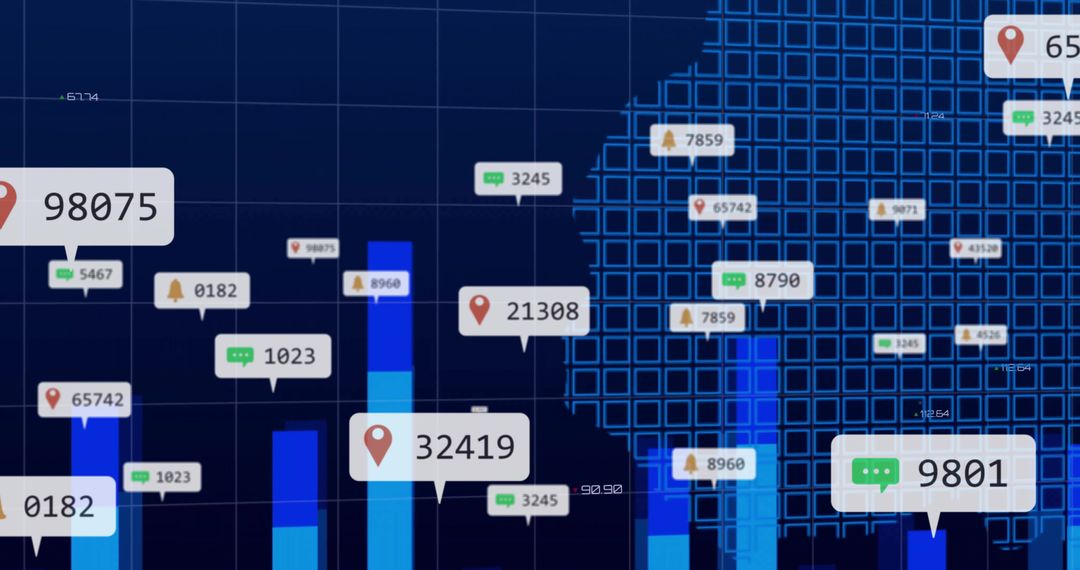
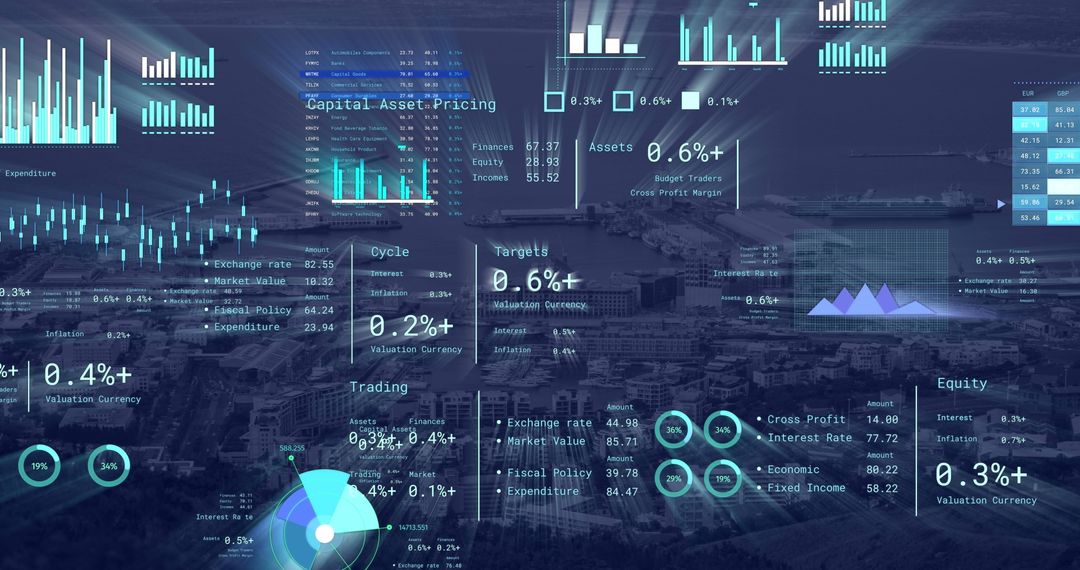
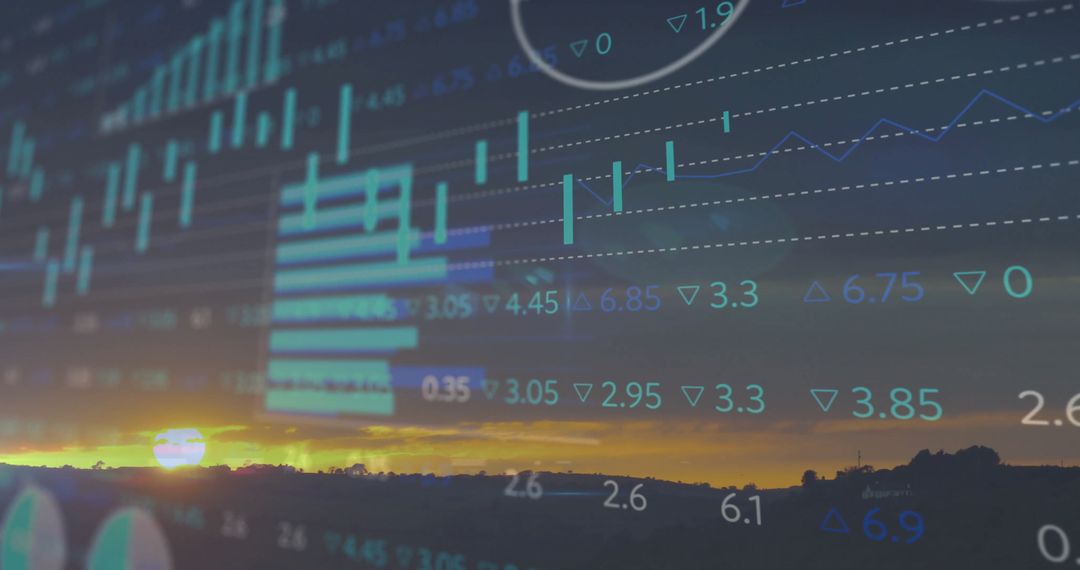
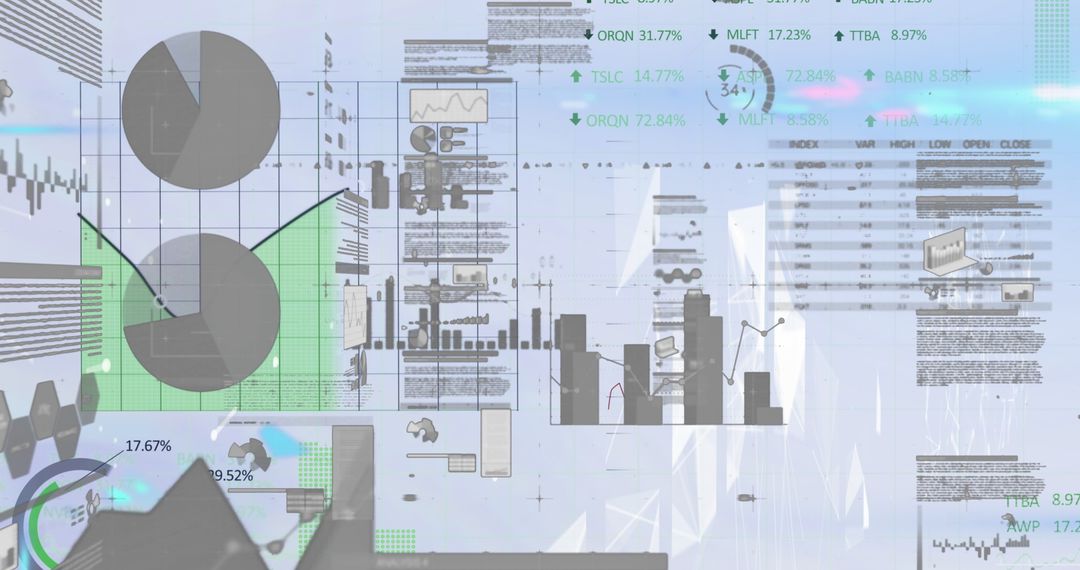
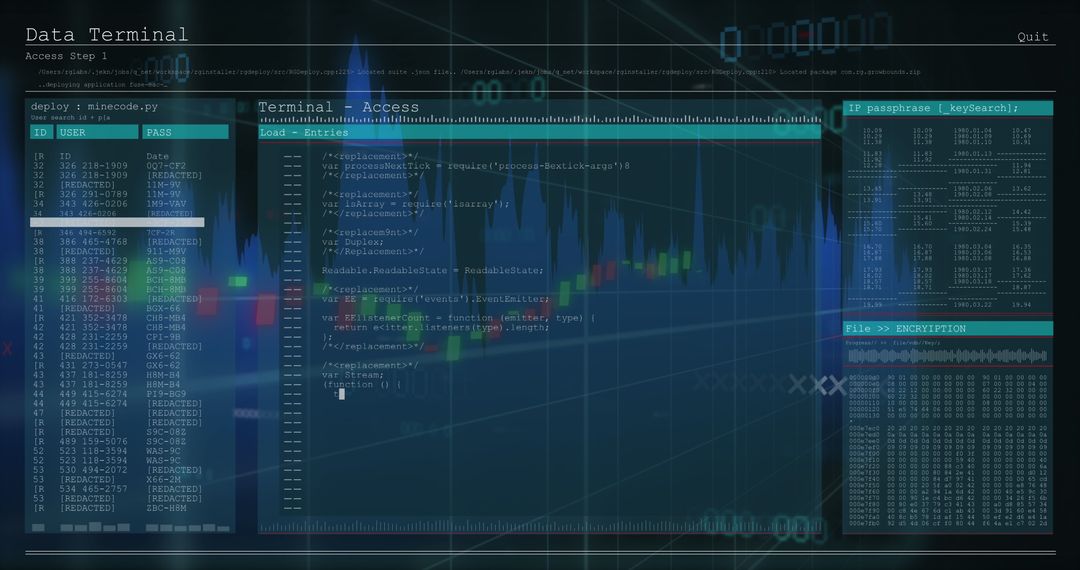
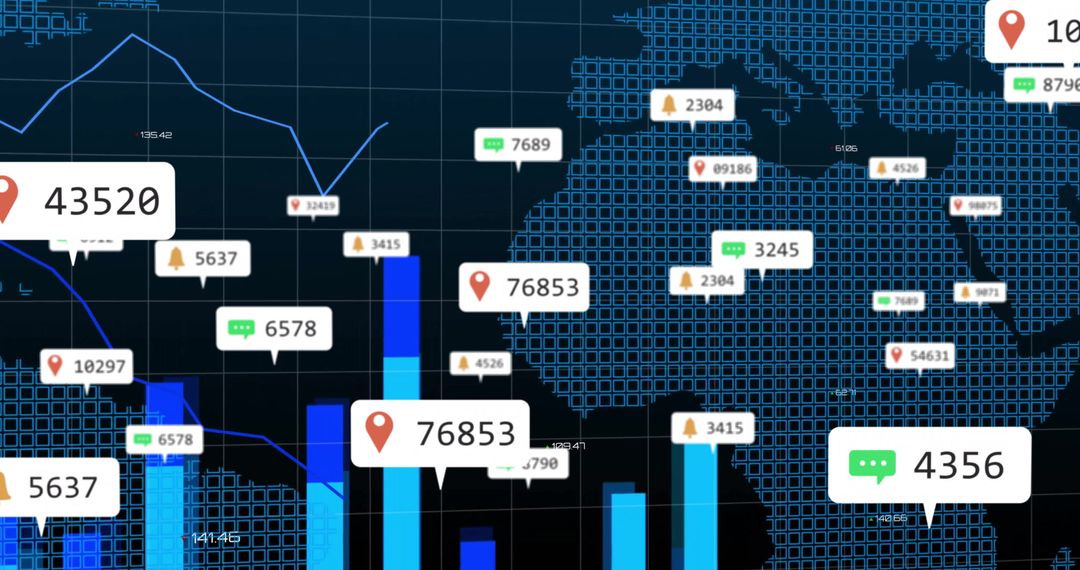
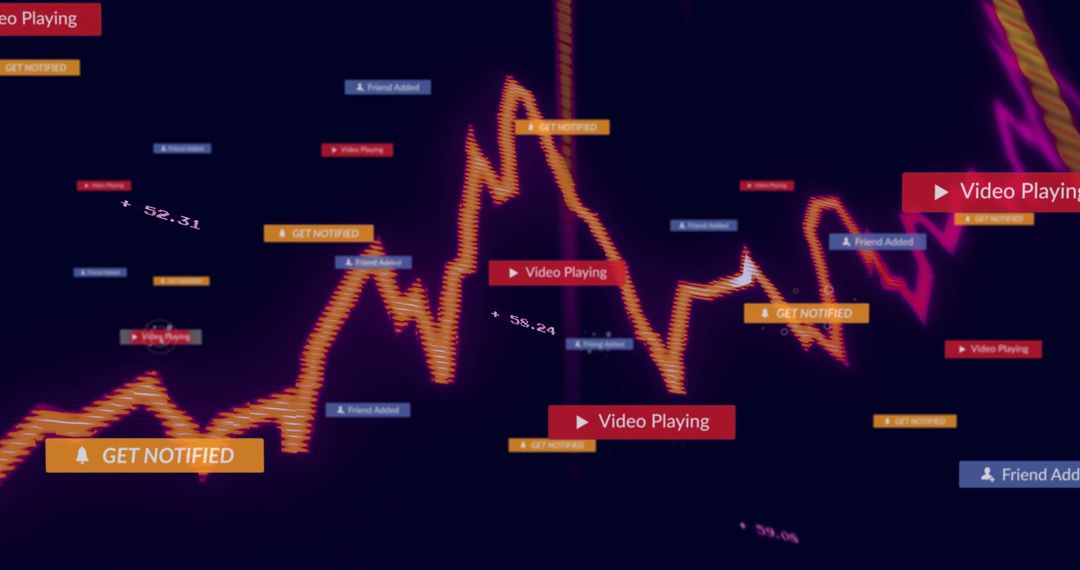
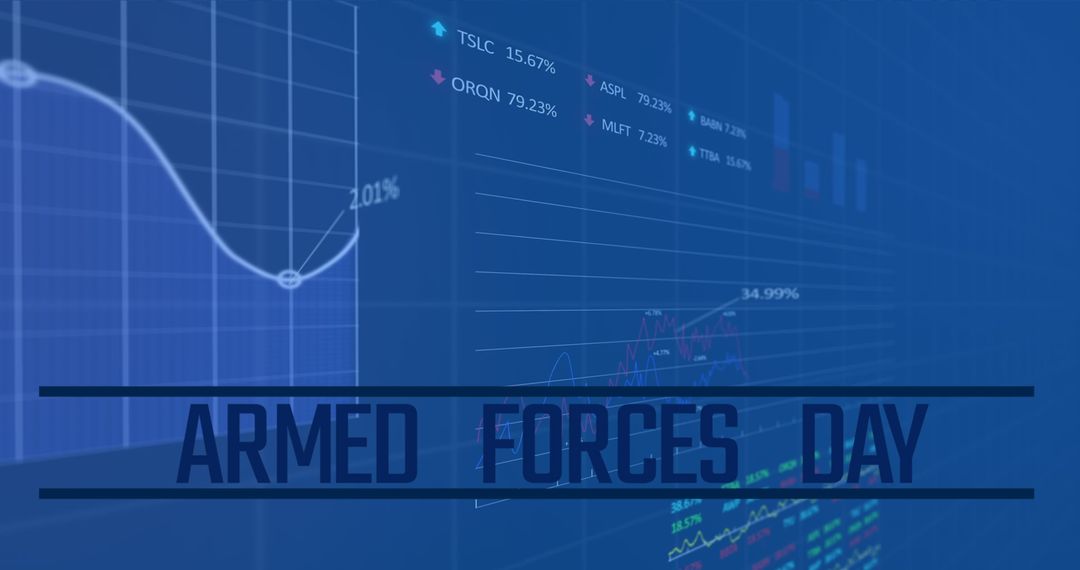
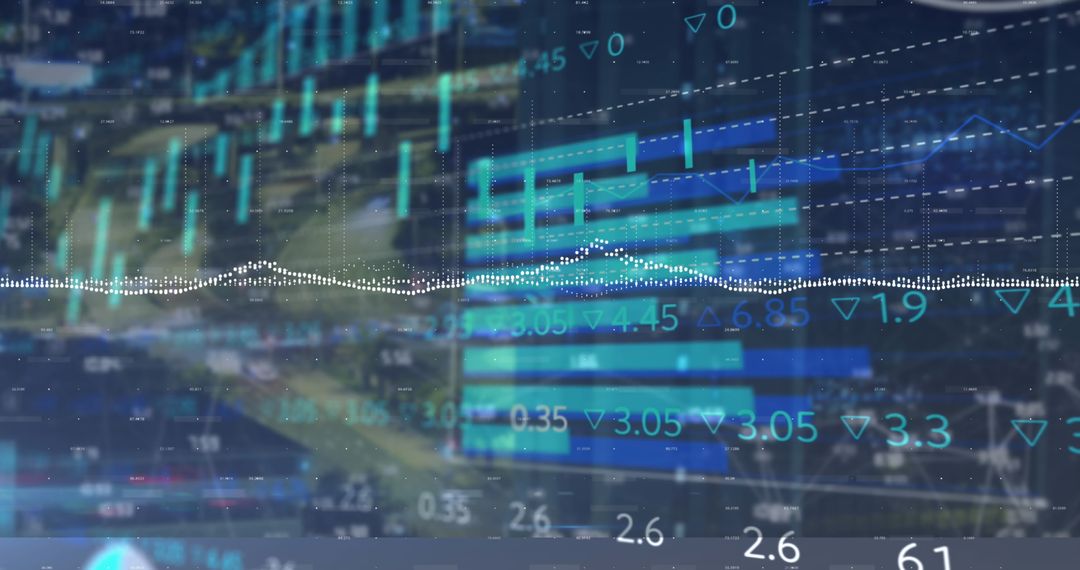
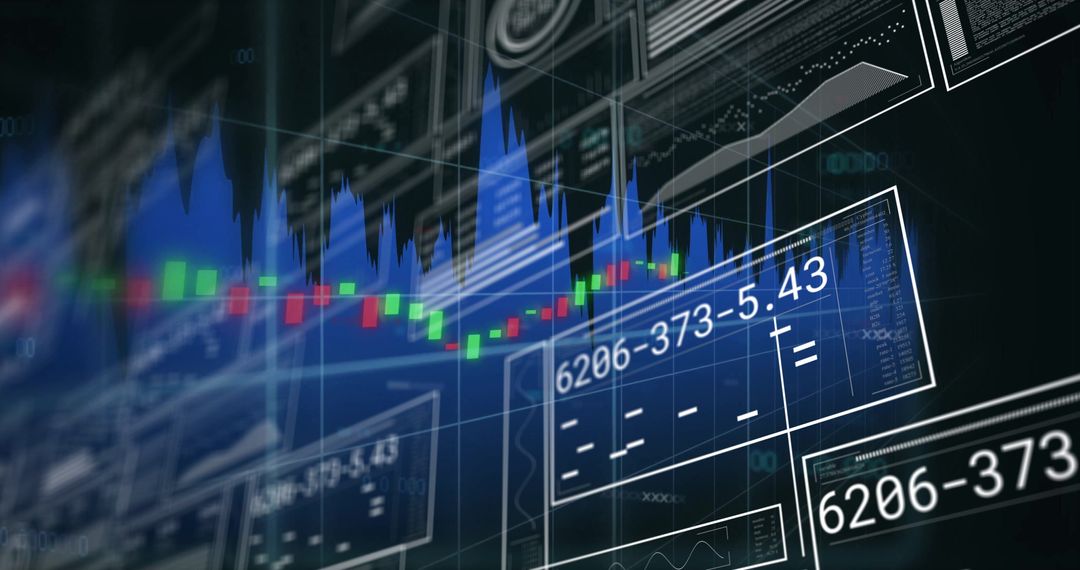
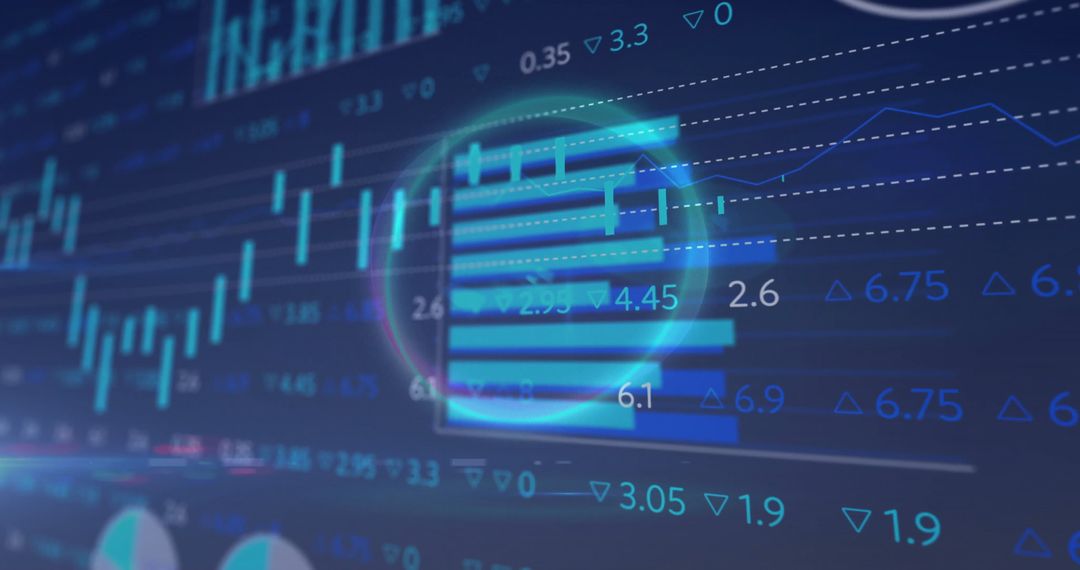
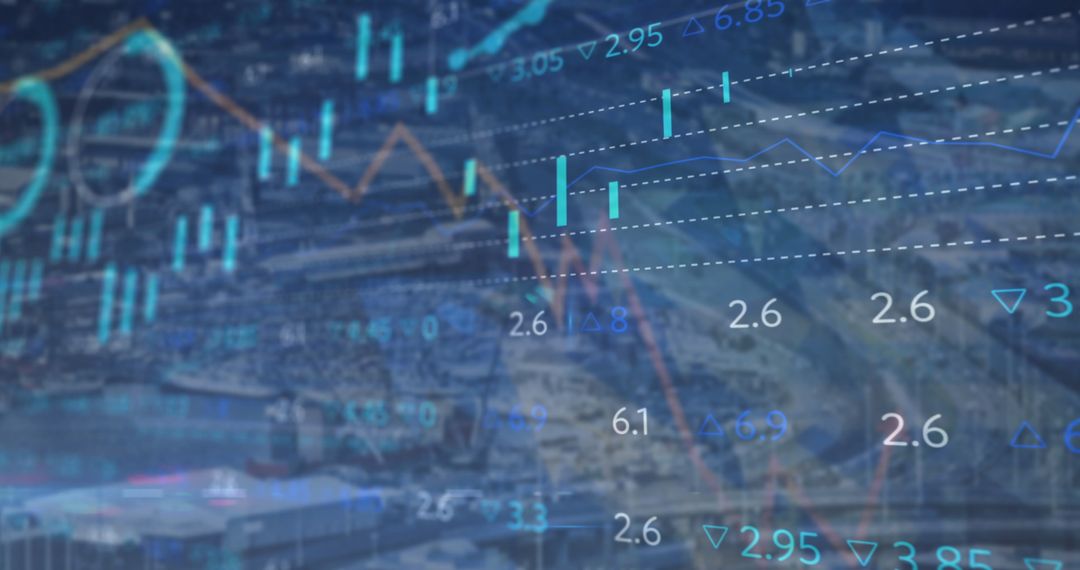
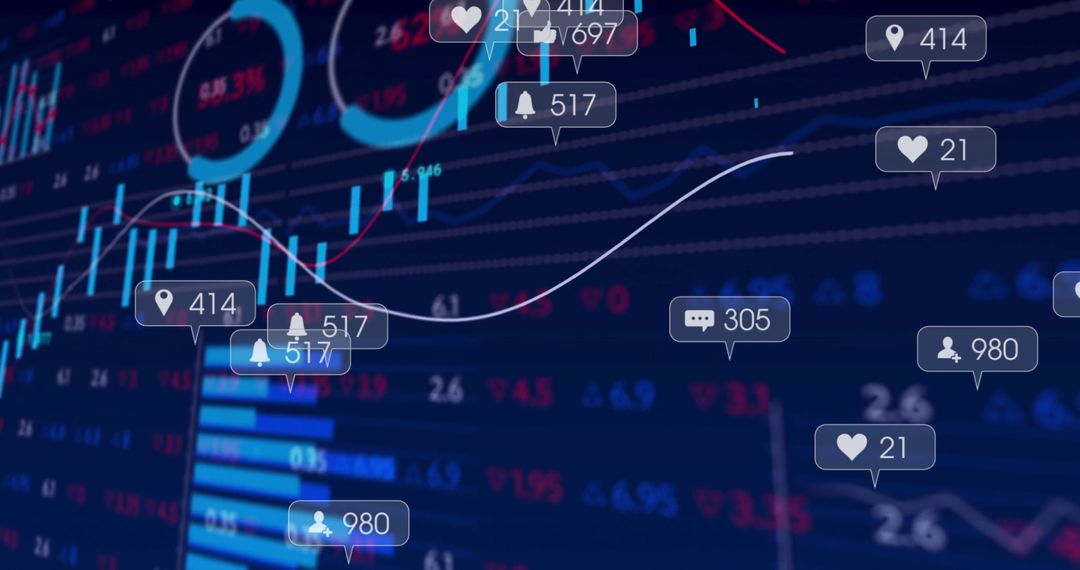
- Financial Analytics Dashboard with User Engagement Alerts
Financial Analytics Dashboard with User Engagement Alerts Image
Visual portrays intricate financial analytics interface designed for monitoring stock movements and user interactions. The UI displays varying analytics elements including tracking bar charts and candlestick signals integrated with pop-up alerts reporting live notifications such as new video playing and friend added, facilitating seamless interaction insights. Useful for presentations on financial technology, training materials for UI/UX design, stock market applications, or promotional content for data visualization tools.
Powered by  - Get 15% off with code: PIKWIZARD15


0
downloads
downloads
Tags:
More
Credit Photo
If you would like to credit the Photo, here are some ways you can do so
Text Link
photo Link
<span class="text-link">
<span>
<a target="_blank" href=https://pikwizard.com/photo/financial-analytics-dashboard-with-user-engagement-alerts/e787bd9d170906aa52adf7eab8f9ed11/>PikWizard</a>
</span>
</span>
<span class="image-link">
<span
style="margin: 0 0 20px 0; display: inline-block; vertical-align: middle; width: 100%;"
>
<a
target="_blank"
href="https://pikwizard.com/photo/financial-analytics-dashboard-with-user-engagement-alerts/e787bd9d170906aa52adf7eab8f9ed11/"
style="text-decoration: none; font-size: 10px; margin: 0;"
>
<img src="https://pikwizard.com/pw/medium/e787bd9d170906aa52adf7eab8f9ed11.jpg" style="margin: 0; width: 100%;" alt="" />
<p style="font-size: 12px; margin: 0;">PikWizard</p>
</a>
</span>
</span>
Free (free of charge)
Free for personal and commercial use.
Author: Creative Art
Similar Free Stock Images

Premium


Premium


Premium


Premium


Premium


Premium


Premium


Premium


Premium


Premium


Premium


Premium


Premium


Premium


Premium


Premium


Premium


Premium