- Home >
- Stock Photos >
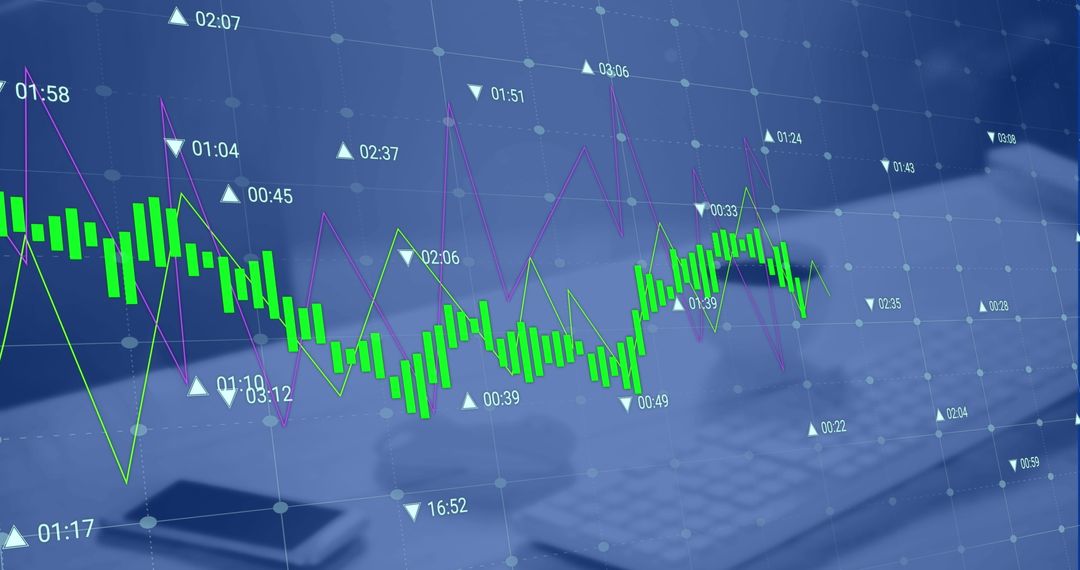
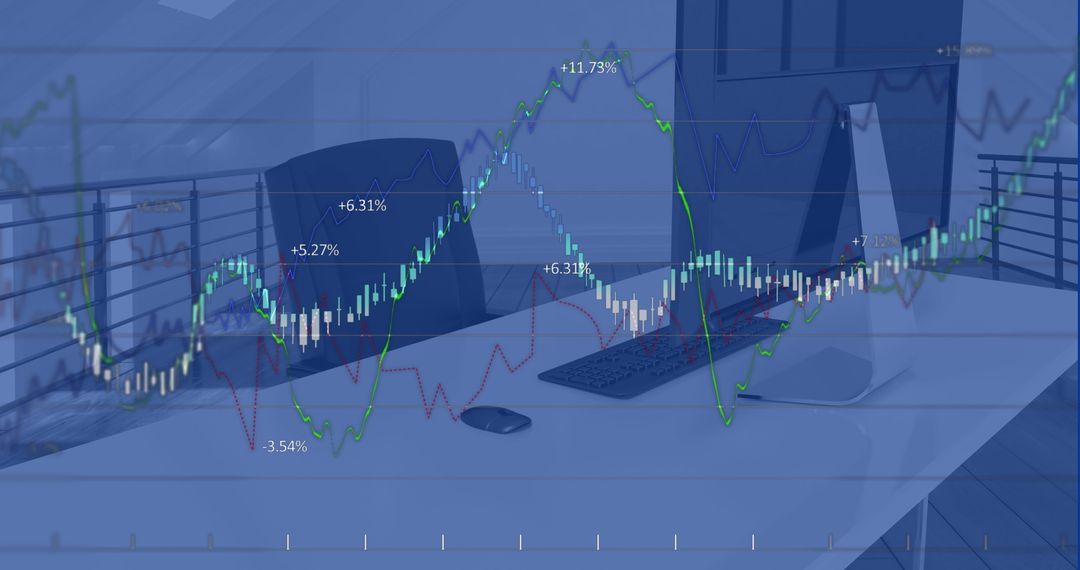
- Financial Analytics Data Overlay on Office Desk
Financial Analytics Data Overlay on Office Desk Image

This image features financial data graphs and charts overlaid on an office desk, creating a modern representation of business analytics and global finance concepts. Desk cluttered with office supplies like documents and stationery highlights a workplace environment focused on financial planning. Perfect for illustrating articles on market trends, financial strategy or corporate presentations relating to data analytics or finance-related topics.
Powered by  - Get 15% off with code: PIKWIZARD15


4
downloads
downloads
Tags:
More
Credit Photo
If you would like to credit the Photo, here are some ways you can do so
Text Link
photo Link
<span class="text-link">
<span>
<a target="_blank" href=https://pikwizard.com/photo/financial-analytics-data-overlay-on-office-desk/79c69f5b203ef40b5455fb56df3af25c/>PikWizard</a>
</span>
</span>
<span class="image-link">
<span
style="margin: 0 0 20px 0; display: inline-block; vertical-align: middle; width: 100%;"
>
<a
target="_blank"
href="https://pikwizard.com/photo/financial-analytics-data-overlay-on-office-desk/79c69f5b203ef40b5455fb56df3af25c/"
style="text-decoration: none; font-size: 10px; margin: 0;"
>
<img src="https://pikwizard.com/pw/medium/79c69f5b203ef40b5455fb56df3af25c.jpg" style="margin: 0; width: 100%;" alt="" />
<p style="font-size: 12px; margin: 0;">PikWizard</p>
</a>
</span>
</span>
Free (free of charge)
Free for personal and commercial use.
Author: Authentic Images
Similar Free Stock Images

Premium


Premium


Premium


Premium


Premium


Premium


Premium


Premium


Premium


Premium


Premium


Premium


Premium


Premium


Premium


Premium


Premium


Premium


Premium


Premium


Premium


Premium


Premium


Premium