1. Home > 
  2. Stock Photos > 
  3. Financial Analytics Data Visualization with Graphs and Charts

Financial Analytics Data Visualization with Graphs and Charts Image

Financial Analytics Data Visualization with Graphs and Charts

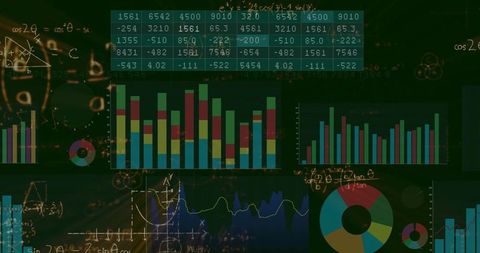
Complex visual display of financial analytics presenting various graphs and charts. This image may appeal to settings involving finance, business strategy, or data analysis, suitable for illustrating topics related to market trends, economic analysis, and financial reporting. Useful for corporate presentations, reports, or fintech marketing materials.

Powered by Adobe logo
A business professional engages with a tablet, analyzing financial data presented through interactive charts and graphs, enhancing strategic insights for decision making. Scalp - Powered by AdobeColorful digital screen with glowing forex and stock market candlestick chart and data analysis on dark interface background for modern financial display. 3D Rendering - Powered by AdobeBusiness professionals collaborating and analyzing financial data on a laptop with charts and graphs during a meeting - Powered by AdobeDynamic digital financial graph with glowing purple and blue trend lines on dark background displaying market analytics data for investment technology - Powered by Adobe
Dynamic blue and green digital stock market graph with bar charts and lines on a dark background, representing financial data analysis, investment trends, business growth, and global economy fluctuat - Powered by Adobe

Credit Photo

If you would like to credit the Photo, here are some ways you can do so

Free (free of charge)

Free for personal and commercial use.

Author: People Creations

Similar Free Stock Images

Financial Data Processing Over Digital Interface and Graphs
Premium
Laptop, investment graphs and business woman reading IPO analytics, financial bank chart or accounting value, info or stocks. Trade price, admin data analysis and profile of broker review statistics
Digital Financial Graphs and Data Analysis Visualization
Dynamic Digital Data Processing and Analysis Graphs
Premium
Person using tablet displaying holographic financial charts and graphs financial data analytics
Financial Data Projection in Modern Office Space
Digital Financial Data Analytics on Dark Interface
Abstract Graphic Business Data Visualization
Digital Data Processing with Technology Interface on Blue Background
Digital DNA and Brain Data Interface Display in Dark Theme
Financial Graph with Data Analysis and Market Statistics
Stock Market Analysis with Graphs and Trading Data
Colorful Financial Data Visualization on Digital Grid
Premium
Abstract digital circuit design with glowing elements and data visualization resembling financial graphs.
Digital Interface of Data Processing Over Cityscape
Dynamic Financial Data Analysis and Graphs for Market Trends
Digital Finance Art with Graphs and Currency Symbols Overlapping
Digital Workspace with Interactive Analytics Dashboard
Displaying financial market trends with blue and red line charts, dotted histogram columns and perce
Financial Data Processing Visualization on Dark Background
Financial Analytics Dashboard with Growth Trends and Indicators
Financial Data Charts with Network Connections Digital Interface
Dynamic Digital Display of Financial Data
Premium
Digital forest data analysis with glowing charts and bar graphs. Abstract concept of environmental economics finance and tech, showing growth and trends in nature.
Dynamic Forex Market Chart with Multiple Currencies and Growth Trends
Dynamic Stock Market Graph with Data Metrics Background
NFT Trading Analytics Dashboard with Graphs and Data Metrics
Premium
Market chart of business increase stock graph or investment financial data profit on growth money diagram background with success diagram exchange information. hyper realistic
Neon Finance Dashboard Displaying Red and Blue Trend Lines, Grid, Glow, Market Tickers
Financial Data Charts on Digital Interface Background
Data Analysis Process with Green Digital Interface
Digital Financial Data Analysis with Infographics and Charts
Digital Display of Financial Data with Graph and Figures
Abstract Digital Stock Market Interface with Graphs and Data
Dynamic Financial Data Analysis with Digital Interface
Dynamic Financial Data Analysis with Virtual Screen
Financial Chart with Dynamic Data on Black Grid
Premium
Representation of data analytics,charts, graphs and data driven insights emerging from a sea of information
Premium
AI finance business data analysis digital technology investment trading market stock, financial analyst using advanced holographic interface for global market insight, smart investment strategy
Premium
Two professional analyzing financial data graphs, charts on laptop display at a modern workspace. Financial analysis or business evaluation concept
Premium
Manager touches growth graph on analytics dashboard. Business data analysis reports with marketing finance management strategy. Digital charts graphs increase business performance, sales statistic
Abstract Financial Graph Display on Dark Background
Dynamic Financial Graph Displaying Market Trends
Digital Stock Market Data and Trends Visualization
Abstract Digital Stock Market Analysis with Graphs
Premium
business statistics info graphics, pie charts, bar graphs, and numerical data, business growth analysis
Graphical Display of Stock Market Trends with Gradient Background
Dynamic Financial Data Processing in Modern Analytics
Cybersecurity Dashboard With Data and Code Elements Display
Financial Data and Graphs on Digital Screen
Premium
Abstract financial chart showing upward trend with superimposed bar and line graphs in blue hues on a light background
Digital Data Analytics with Financial Graphs and Indigo Background
Digital Data Visualization with Geometric and Analytical Charts
Digital Financial Data Processing Interface on Red Background
Colorful Data Analytics Display on Dark Background
Premium
Business finance data analytics graph.Financial management technology.Advisor using KPI Dashboard on virtual screen.
Dark Analytics Dashboard Displaying Financial Charts, Metrics and Neon Interface
Stock Market Analysis and Data Processing Graphic
Digital Financial Chart and Global Currency Symbols on Blue Background
Dynamic Data Visualization with Fluctuating Trendline and Indicators
Premium
A vibrant blue bar chart displays increasing financial data overlaid with a glowing yellow line graph showing a positive upward trend symbolizing economic progress and investment success
Abstract Financial Data Charts and Graphs on Black Background
Dynamic Digital Data Dashboard with Analytics Charts and Graphs
Financial Data Stock Analysis with Code Overlays
Premium
A professional analyzing financial data using a digital tablet with dynamic charts and graphs.
Premium
Data analytics and big data strategy for real-time analytics, predictive data modeling, business intelligence analytics, and data-driven decision-making in modern digital businesses. Thunk
Financial Graph Showing Indices Trends on Blue Background
Rising Financial Graphs with Digital Data Interface
Digital Projection of Financial Data with Bar Graphs
Displaying Cyan Bar and Magenta Line Analytics Over Server Log Data on Dark Neon Dashboard
Financial Graphs and World Map Illustrating Market Data
Futuristic Financial Data Analytics with Digital Interface Concept
Holographic Financial Stock Market Analysis Visualization
Digital Financial Data Interfaces in Global Connection
Financial Data Visualization with Dynamic Graphs and Charts
Digital Financial Dashboard with Cyan Bar and Red Line Graph
Digital Financial Statistics and Analytics Visualization with Graphs
Global Financial Data and Stock Market Trends on World Map
Premium
Man look at the dashboard with graphs and charts. Concept of data management system, business intelligence, data statistics, marketing analysis, key performance indicators (KPI) and analytics.
Premium
Business people analyzing financial charts and graphs at meeting
Premium
A dynamic team collaborates in a modern office setting with digital interfaces displaying financial graphs and analytics, emphasizing strategic growth and innovative ideas. Scalp
Digital Financial Charting and Data Processing on Black Background
Modern Multi-Line Chart on Digital Display with Candlesticks
Digital Data Visualization and Analysis Interface
Premium
Data analysis, business meeting or woman with graph presentation in office for revenue, profit or sale statistics. Chart, analytics or accounting mentor brainstorming economy, inflation or solution
Analytics Dashboard with Dynamic Financial Graphs and Data
Futuristic Data Processing Interface on Blue Background
Colorful Financial Data Charts on Digital Grid Background
Fluctuating Red Line on Digital Analytics Dashboard
Digital Financial Data Analysis on Dark Background
Dynamic Digital Stock Market Chart with Growing Financial Trends
Digital Financial Dashboard with Bar and Line Charts
Digital Financial Data Analyzing with Bar and Line Graphs on Screen
Premium
Financial dashboard with data visualizations, charts, and global analytics, illustrating business trends, market analysis, and strategy for business and economic investment background 3d Rendering
Digital Financial Data Processing and Analysis Graphics
Visionary Financial Data Analysis on Digital Interface
Diverse Graphs and Data Over Urban Landscape
Financial Data Chart Over City Silhouette
Economic Trends Analysis with Financial Indicators and Graphs
Dynamic Stock Market Trends and Financial Data Graph
Digital Financial Data Visualizations on Black Background
Digital Financial Data Analysis with Graphs and Charts on Black Background
Digital Dashboard with Data Trends and Chat Technology Elements
Dynamic Financial Data Analytics Display with Graphs
Rising Graphs and Interactive Financial Data Analytics Background
Premium
Futuristic glowing blue digital dashboard with interactive charts graphs and analytics showing upward growth trend for business financial and technology data visualization concepts
Premium
Businesswoman Managing Company Data Using Analytics Dashboard
Futuristic Data Dashboard with Graphs and Numeric Visuals
Digital Financial Data Interface with Graphs and Trends
Digital Chart Display Financial Data Analysis Background Effects
Financial Data Analysis with Graphs and Charts on Dark Background
Financial Data Charts & Analysis on Dark Screen
Holographic Finance Dashboard Displaying Glitchy Neon Data Streams, Binary Overlay
Holographic Financial Data Visualization with Stock Trends
Financial Data Processing with Graphs and Charts Background
Premium
A model airplane is positioned on top of colorful financial reports that display analytical graphs and data concerning the airline industry. This setup represents business discussions
Colorful Bar Graph with Digital Financial Data Analysis Display
Dynamic Global Financial Data with Multicolored Graph Lines
Colorful Financial Data Analytics and Digital Graph
Futuristic Financial Data Analysis with Graphs and Charts
Premium
Green arrow pointing upward on financial graph. Business growth chart with rising trend line. Digital stock market data visualization for investment analysis
Dynamic Data Visualization Depicting Financial Growth Trends
Premium
Business finance data analytics graph.Financial management technology.Advisor using KPI Dashboard on virtual screen.
Financial Visualization Overlooking Urban Cityscape
Holographic Stock Market Analysis with Charts and Data
Explore More Free Stock Images