- Home >
- Stock Photos >
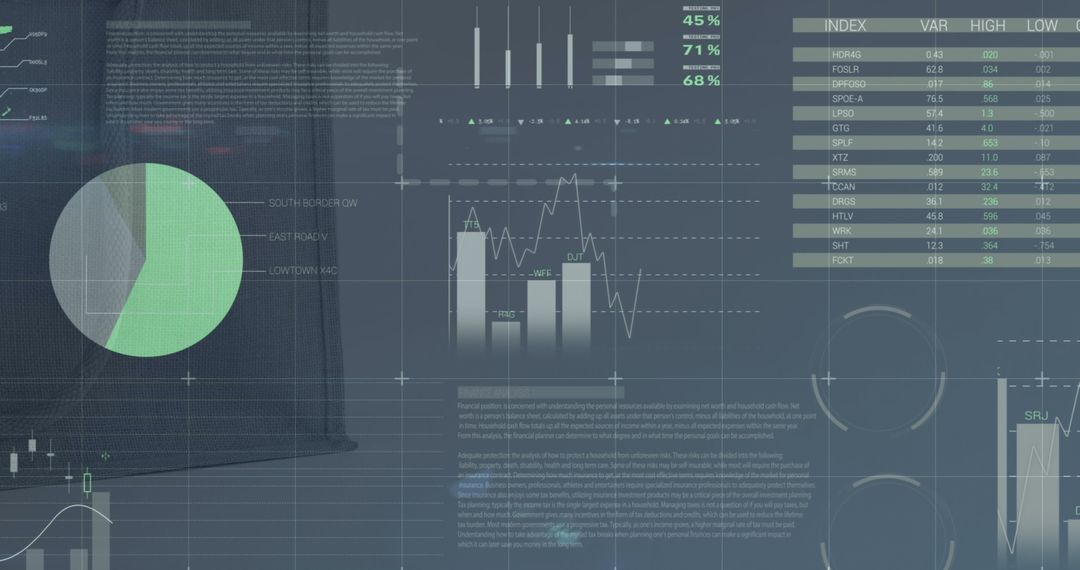
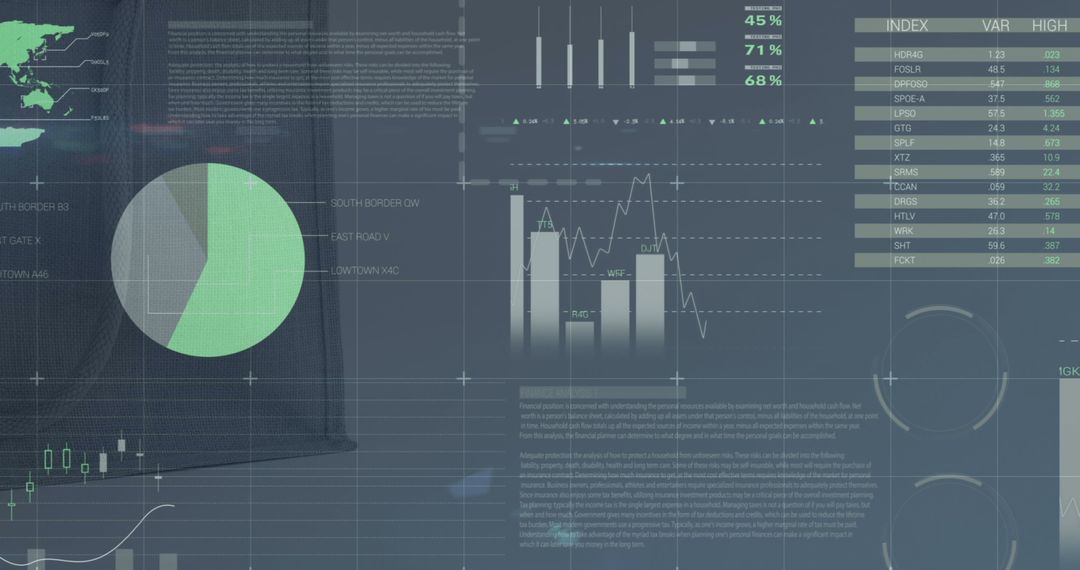
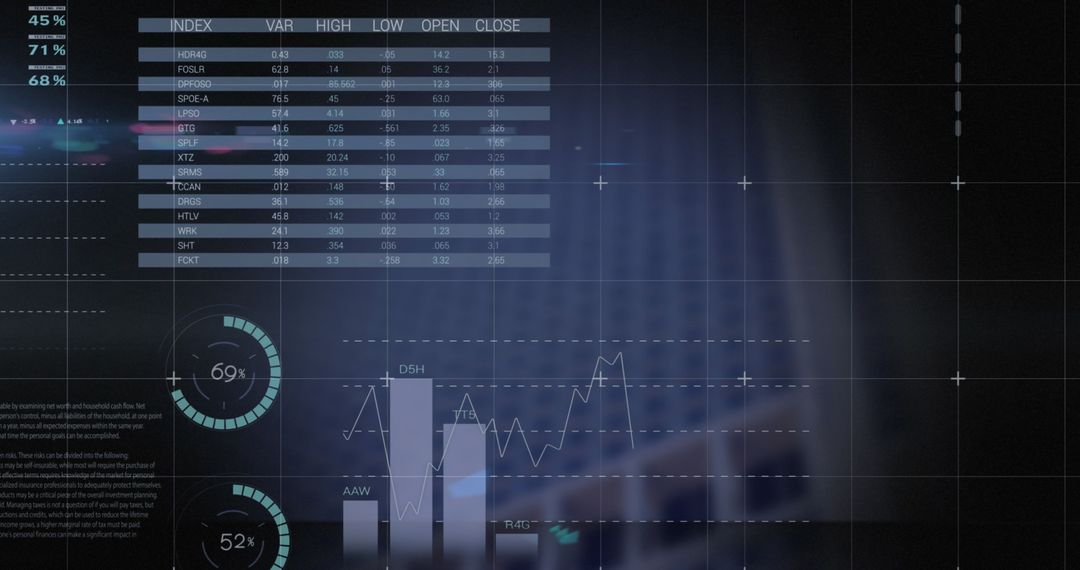
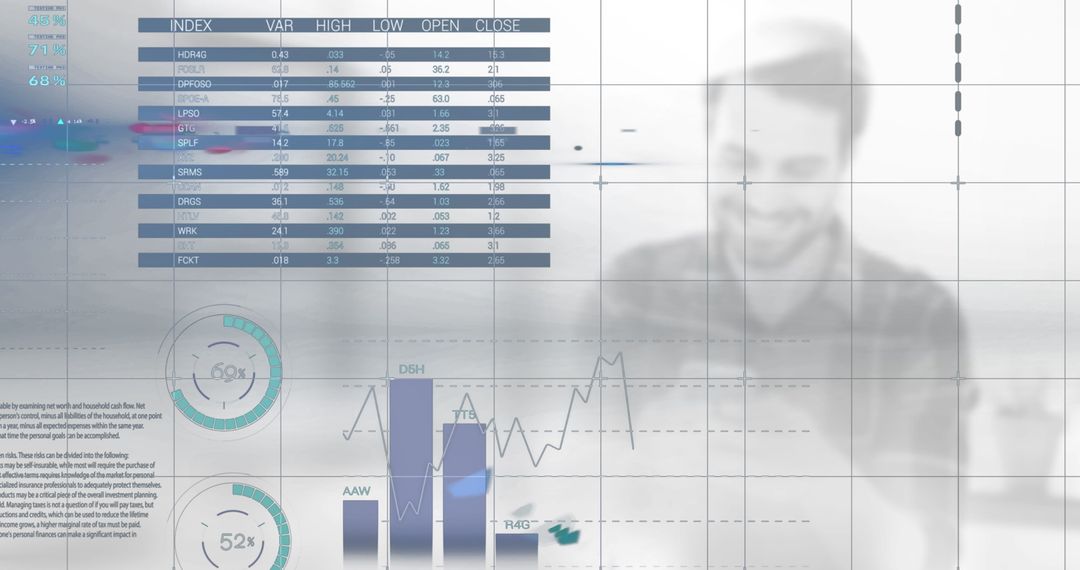
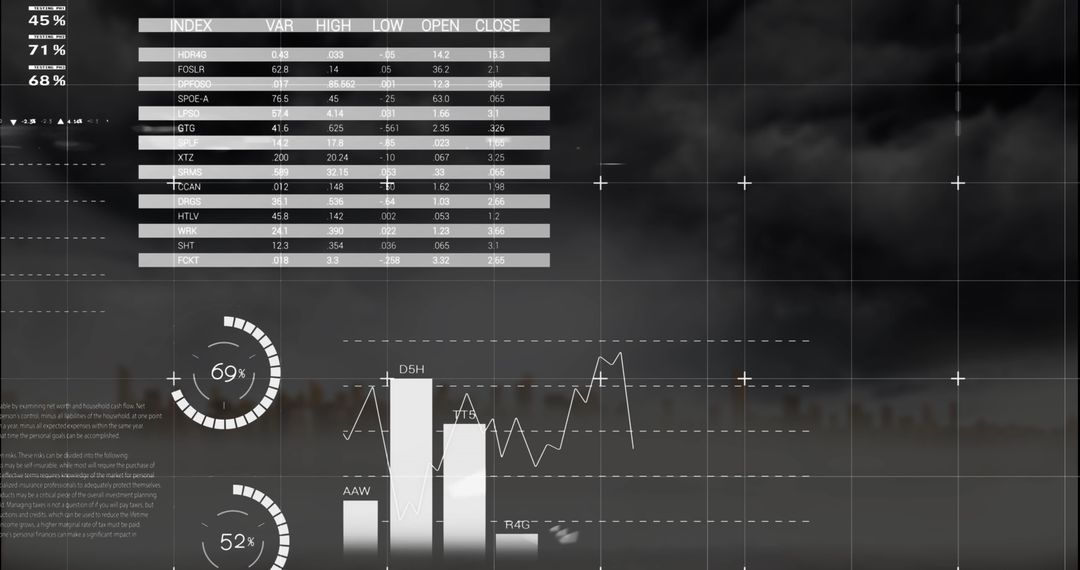
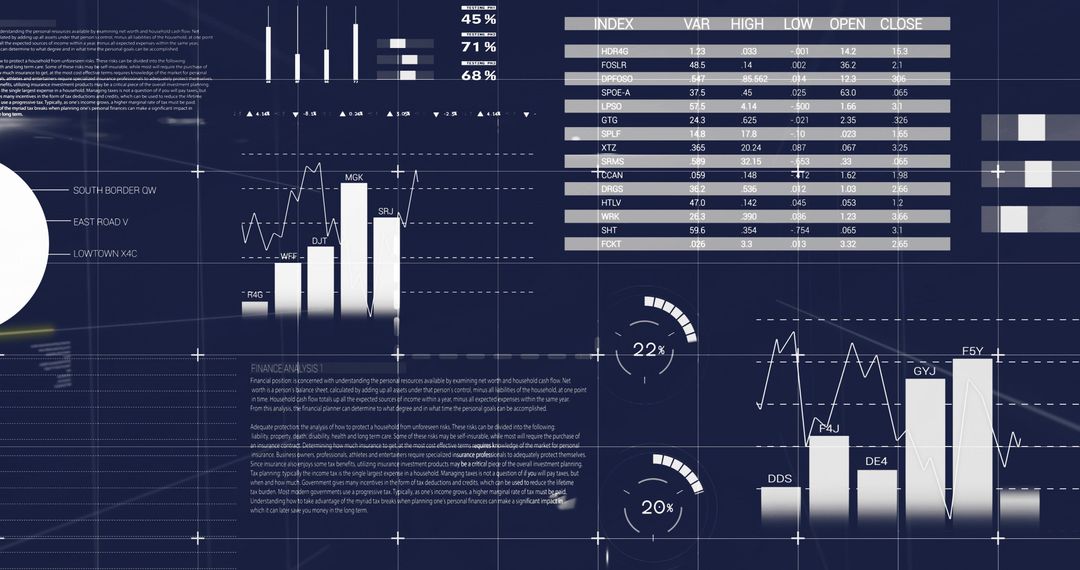
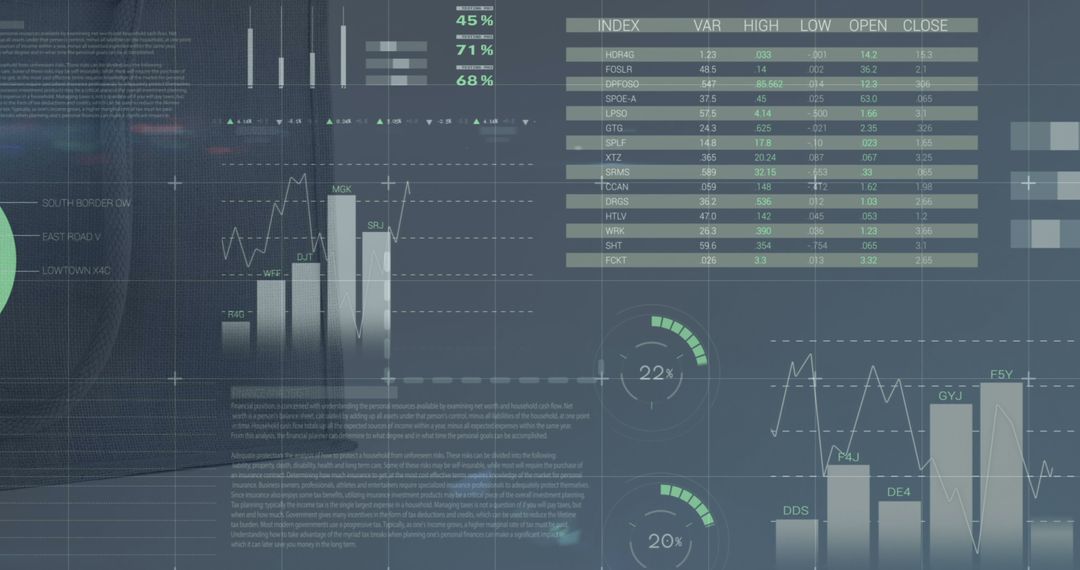
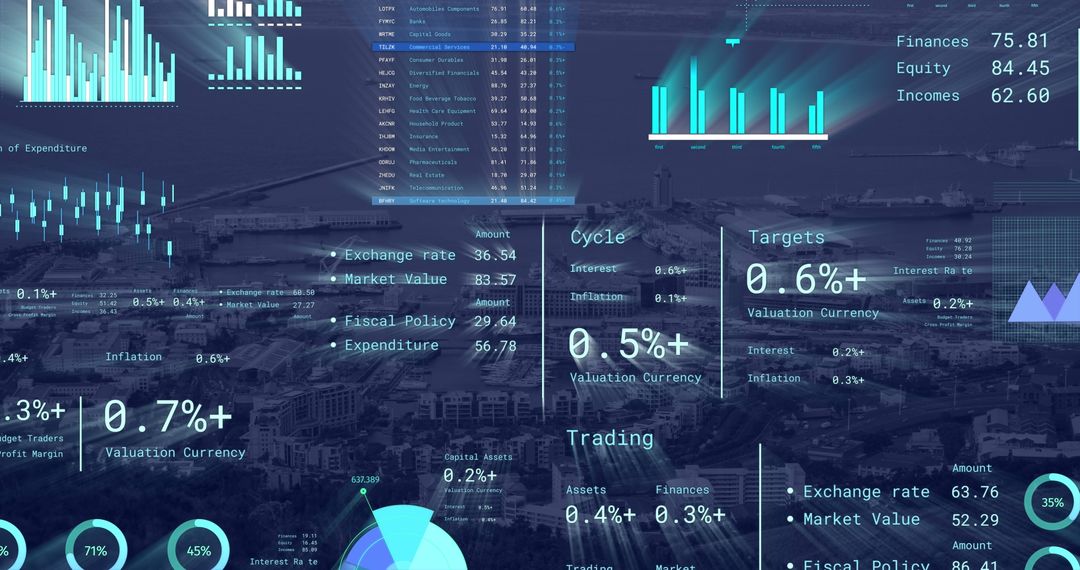
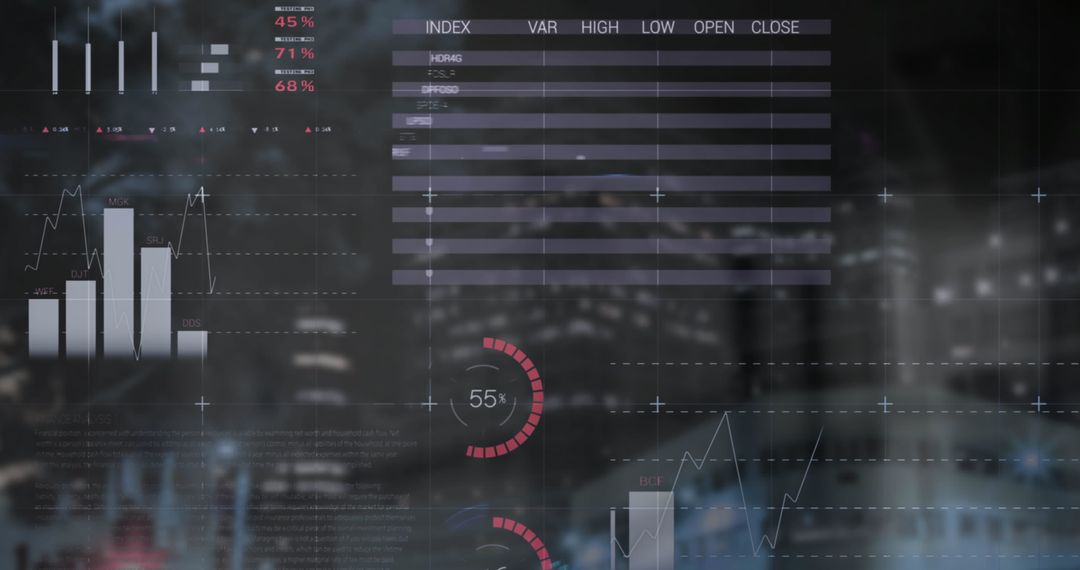
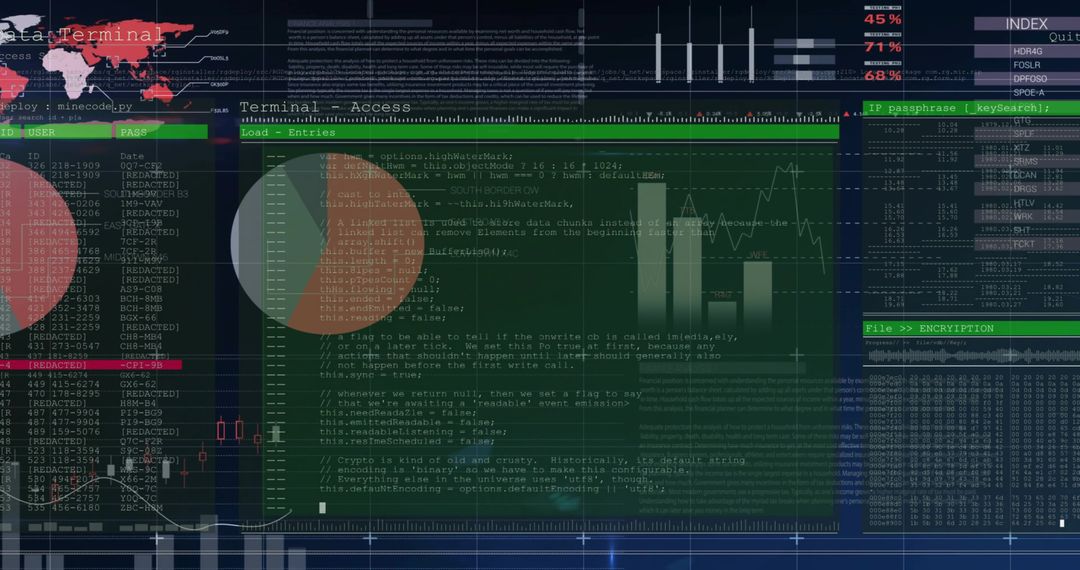
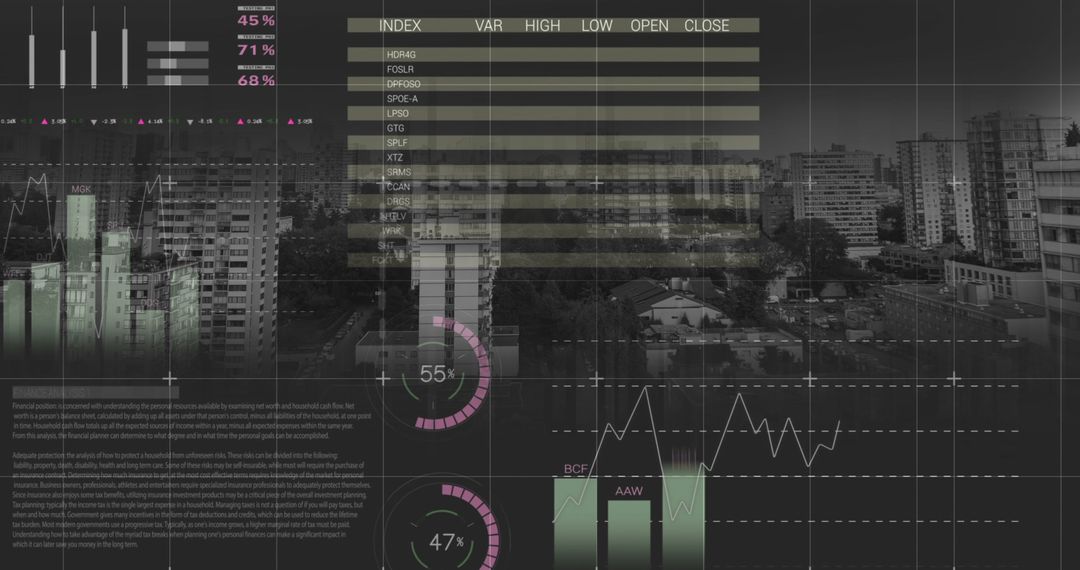
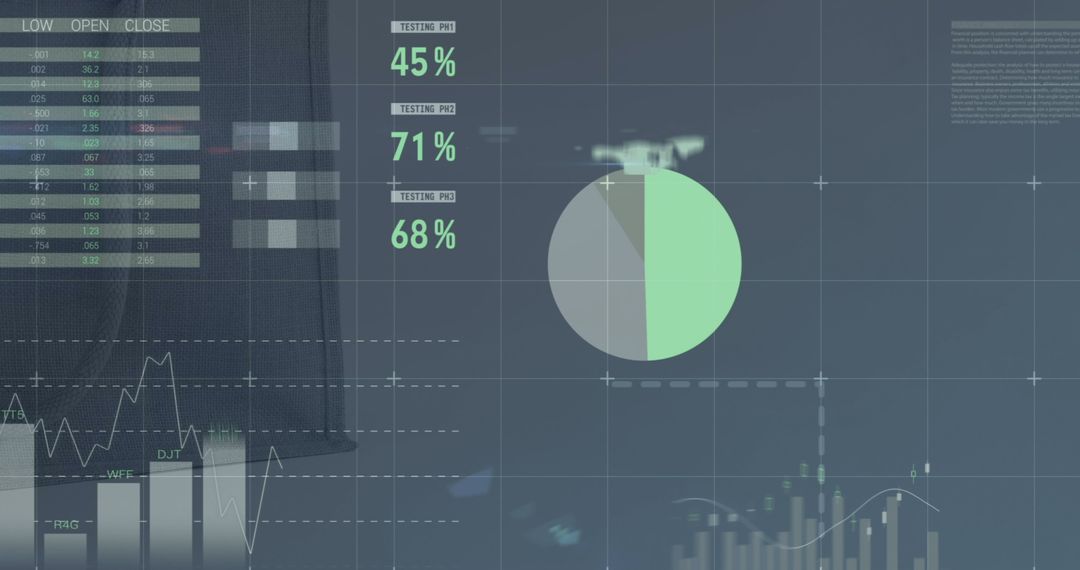
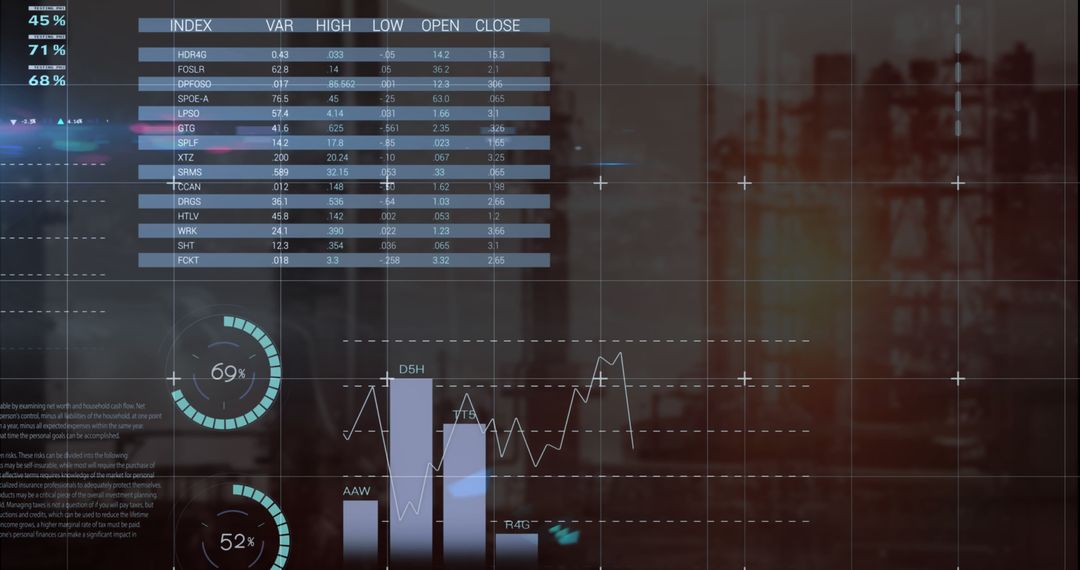
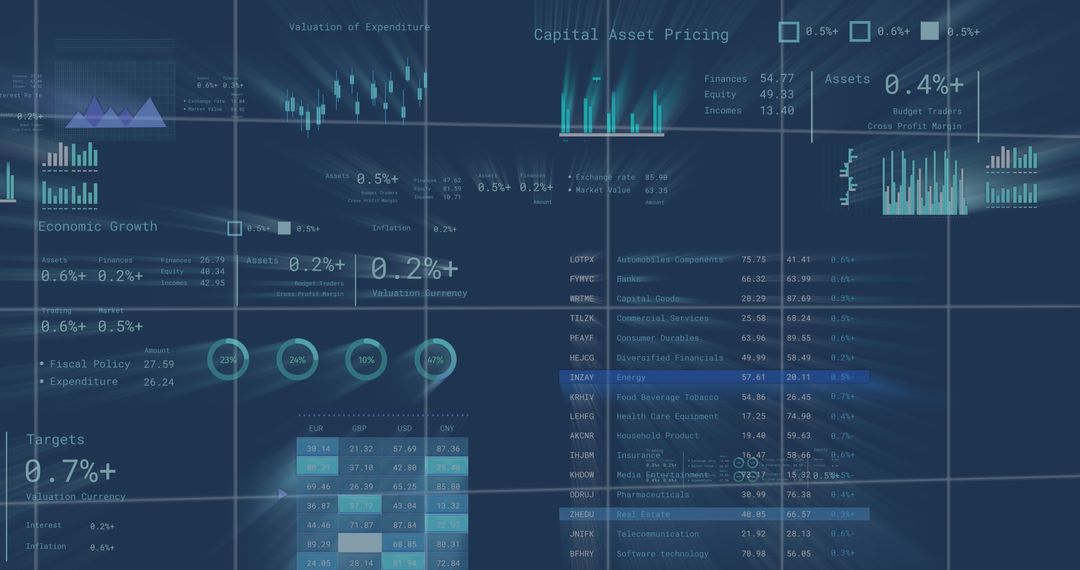
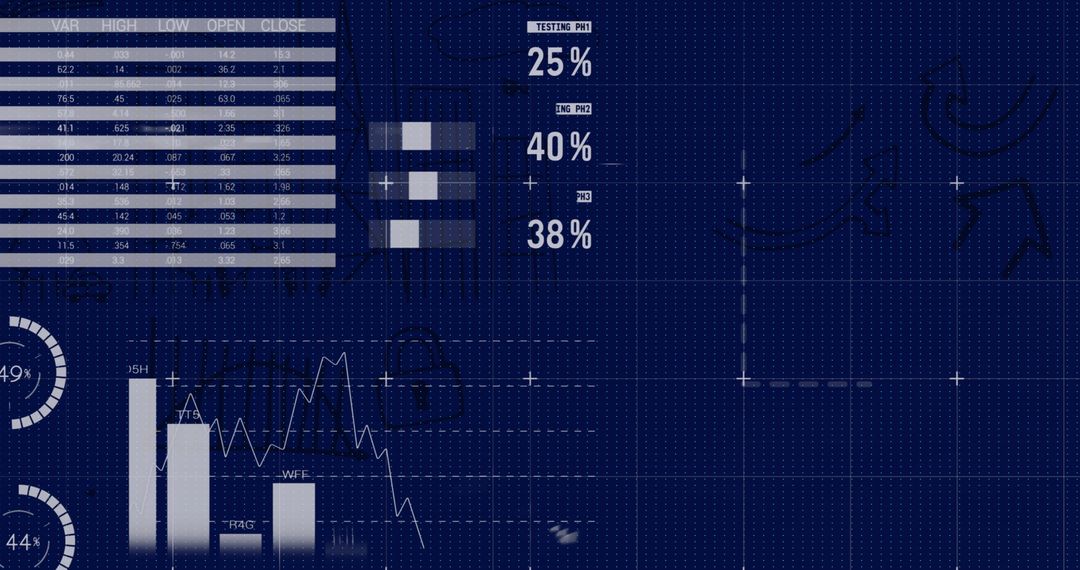
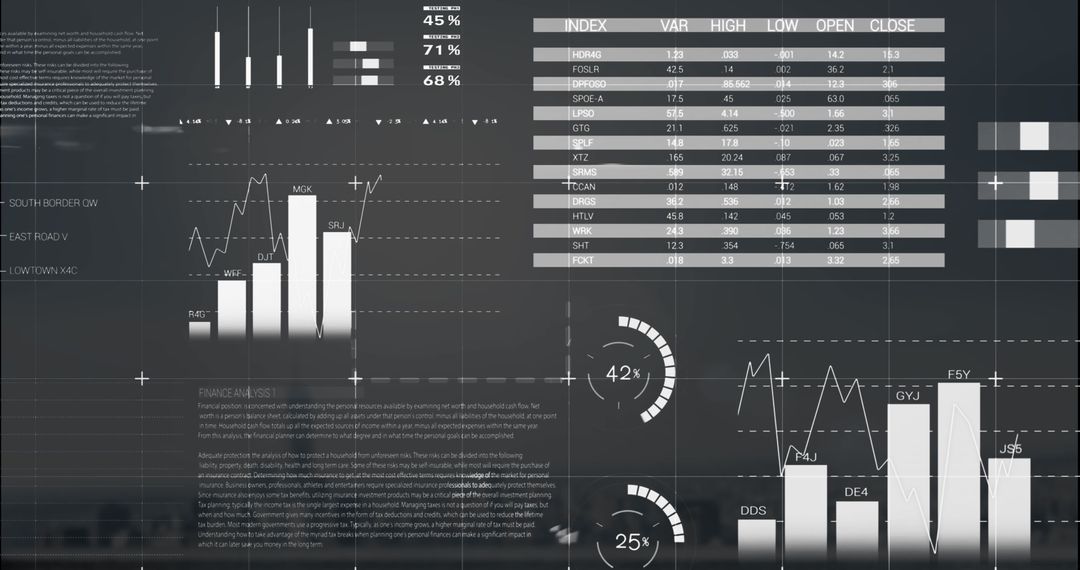
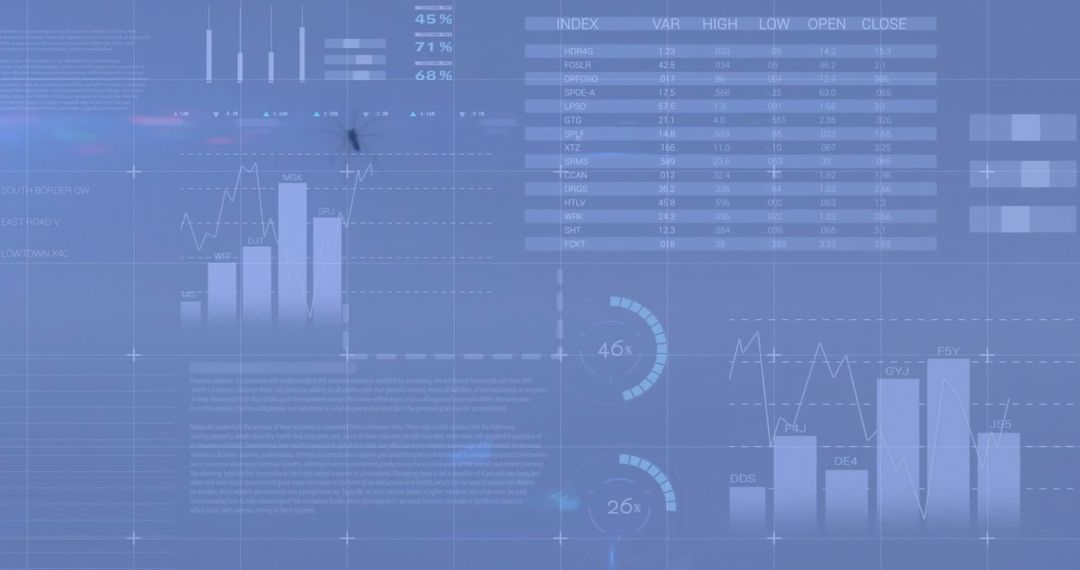
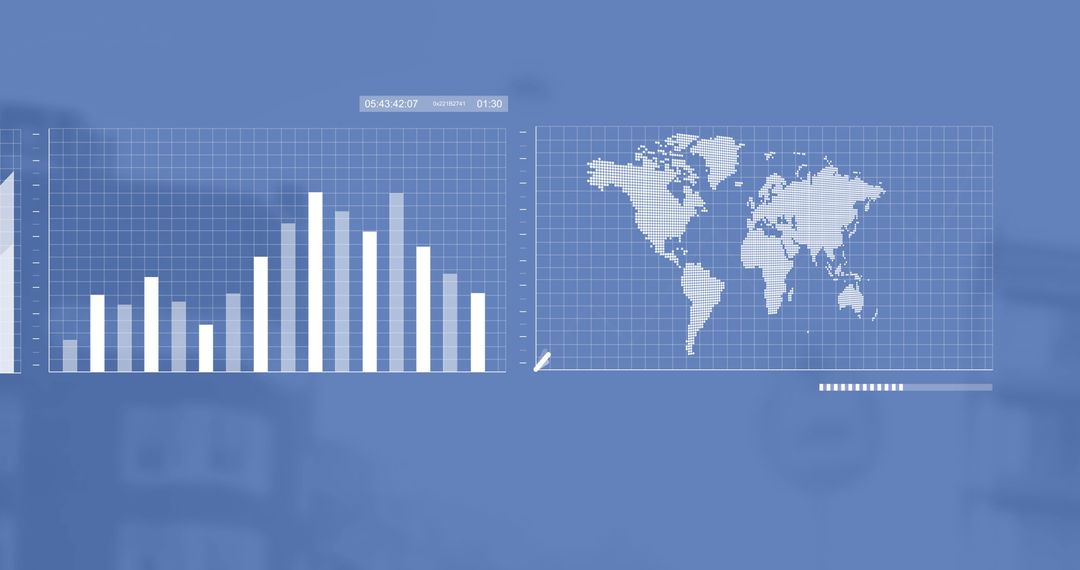
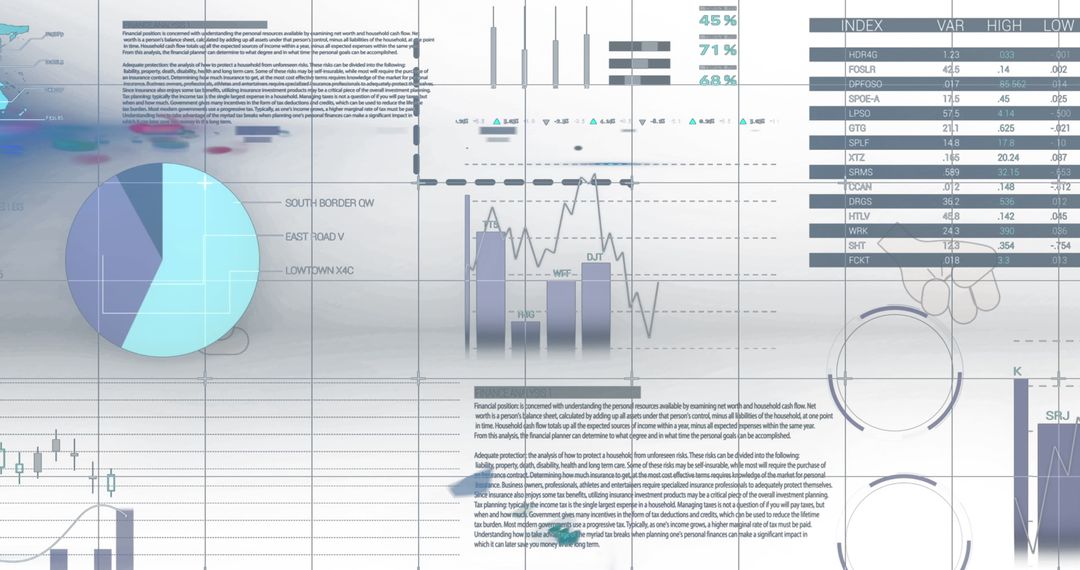
- Financial Analytics Display with Digital Graphs and Charts
Financial Analytics Display with Digital Graphs and Charts Image

Financial analytics display features digital graphs and charts demonstrating various financial metrics. Useful for representing data in business presentations, financial reports, and economic studies, enabling clear analysis and making pie charts, bar graphs, and percentage dialogs essential tools for conveying complex data responses and trends efficiently.
Powered by  - Get 15% off with code: PIKWIZARD15


0
downloads
downloads
Tags:
More
Credit Photo
If you would like to credit the Photo, here are some ways you can do so
Text Link
photo Link
<span class="text-link">
<span>
<a target="_blank" href=https://pikwizard.com/photo/financial-analytics-display-with-digital-graphs-and-charts/904a346f436358018a3d9e2d2ff24d4b/>PikWizard</a>
</span>
</span>
<span class="image-link">
<span
style="margin: 0 0 20px 0; display: inline-block; vertical-align: middle; width: 100%;"
>
<a
target="_blank"
href="https://pikwizard.com/photo/financial-analytics-display-with-digital-graphs-and-charts/904a346f436358018a3d9e2d2ff24d4b/"
style="text-decoration: none; font-size: 10px; margin: 0;"
>
<img src="https://pikwizard.com/pw/medium/904a346f436358018a3d9e2d2ff24d4b.jpg" style="margin: 0; width: 100%;" alt="" />
<p style="font-size: 12px; margin: 0;">PikWizard</p>
</a>
</span>
</span>
Free (free of charge)
Free for personal and commercial use.
Author: Authentic Images
Similar Free Stock Images

Premium


Premium


Premium


Premium


Premium


Premium


Premium


Premium


Premium


Premium


Premium


Premium


Premium


Premium


Premium


Premium


Premium


Premium


Premium


Premium


Premium


Premium


Premium


Premium