- Home >
- Stock Photos >
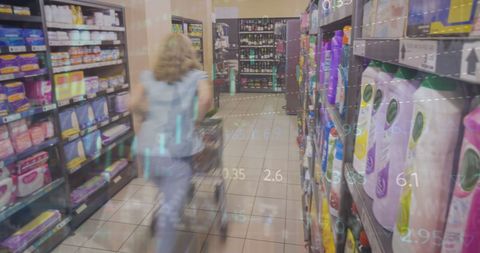
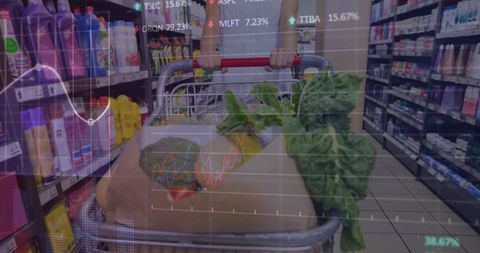
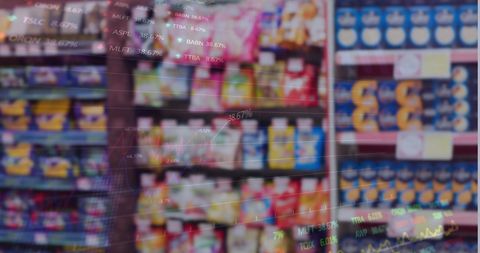
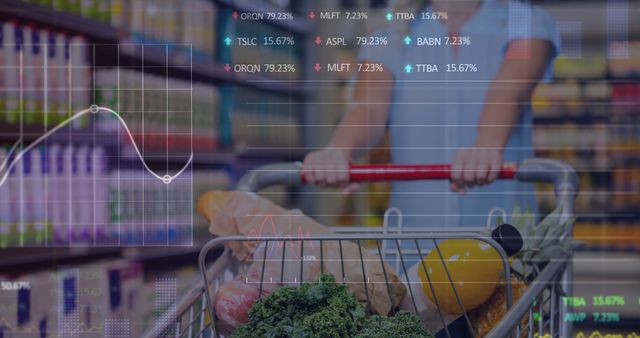
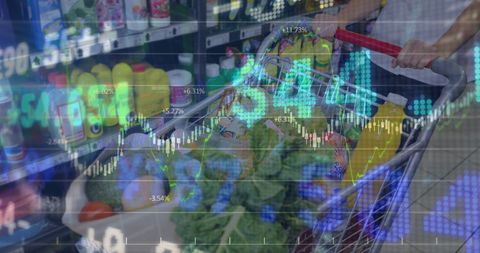
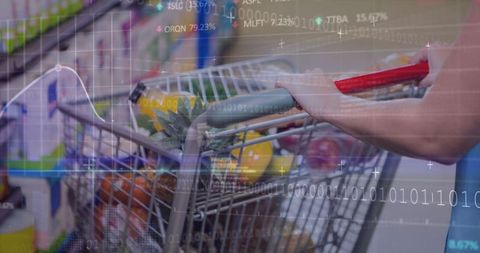
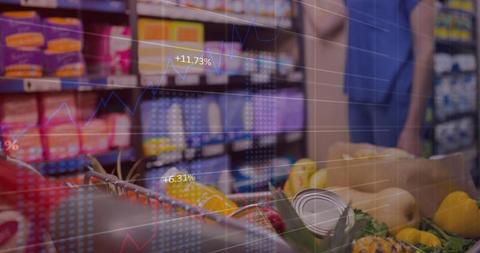
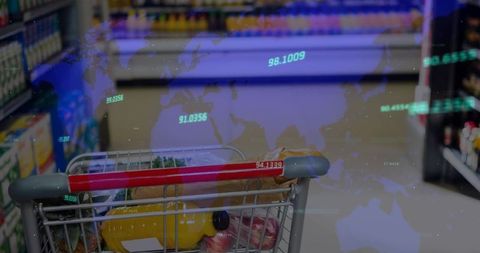
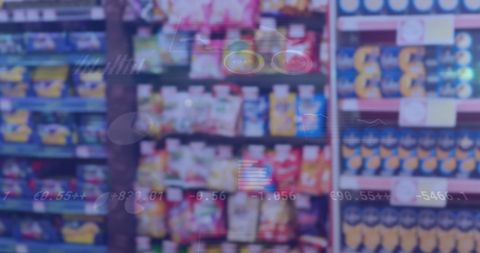
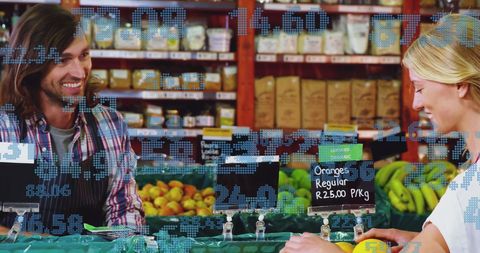
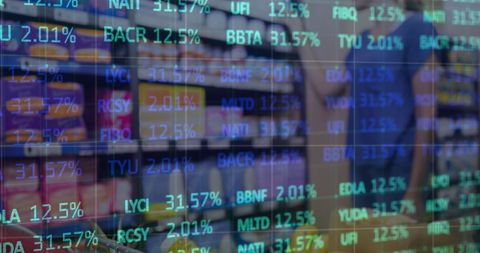
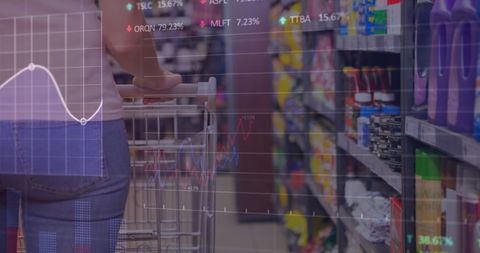
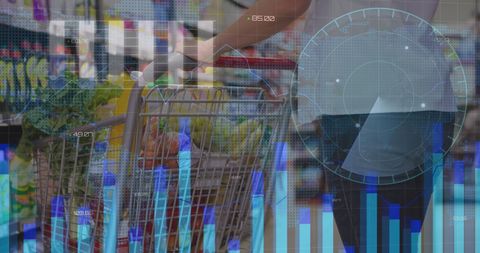
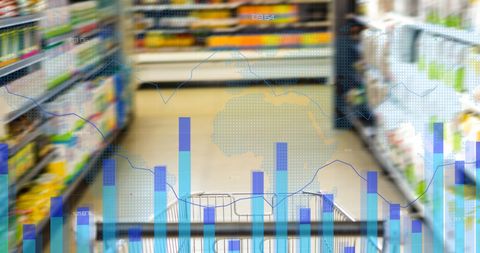
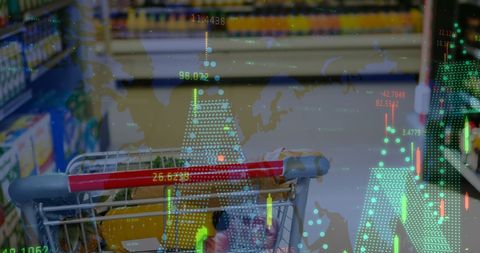
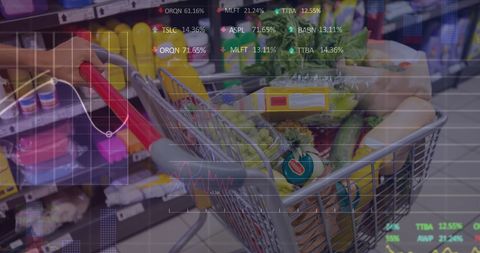
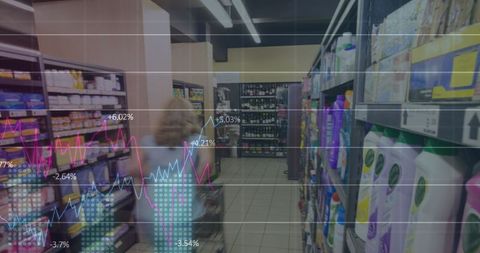
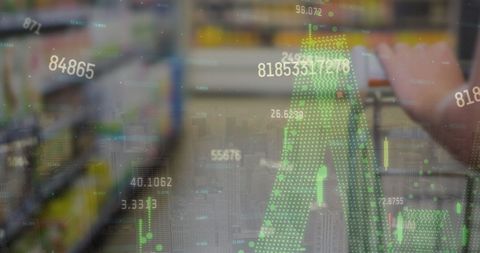
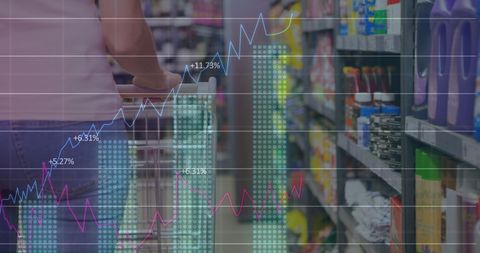
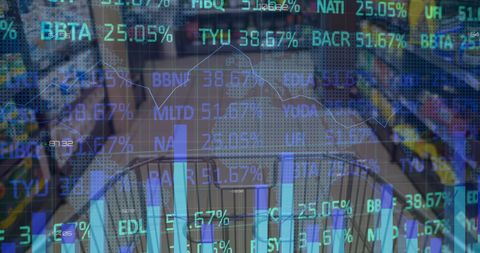
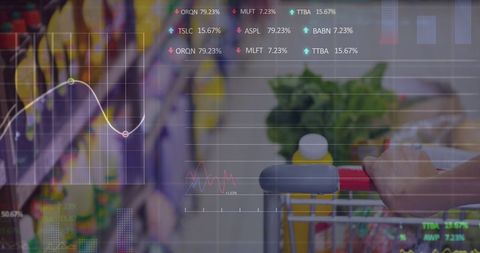
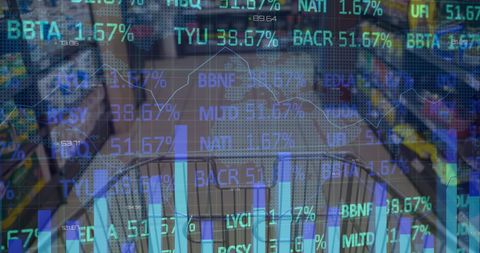
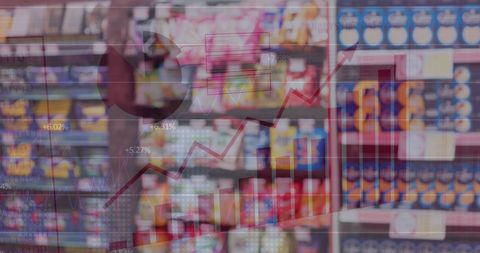
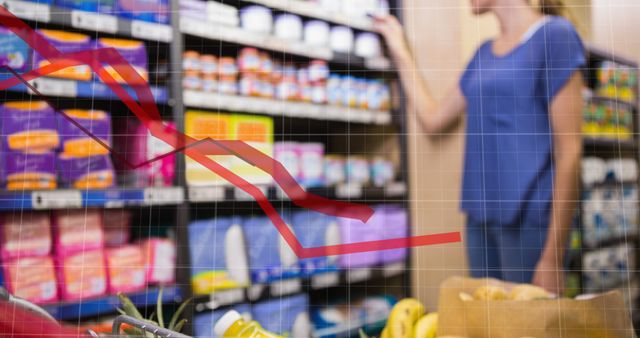
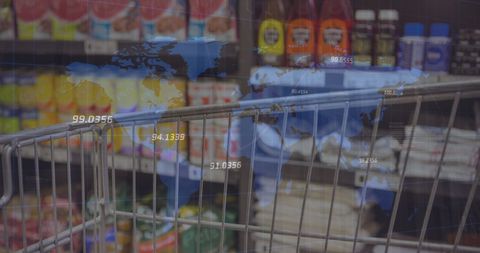
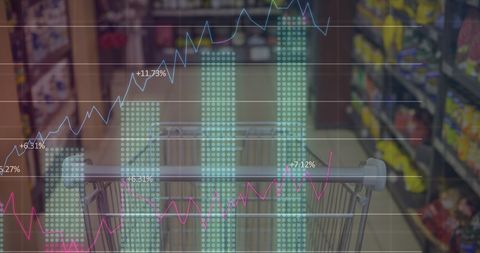
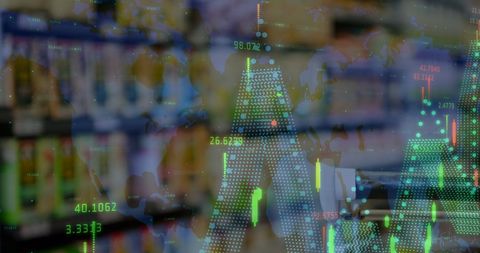
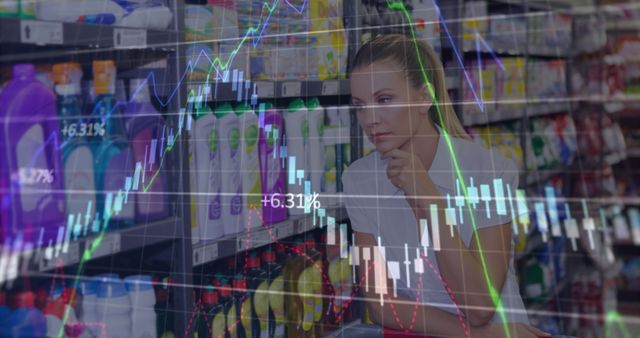
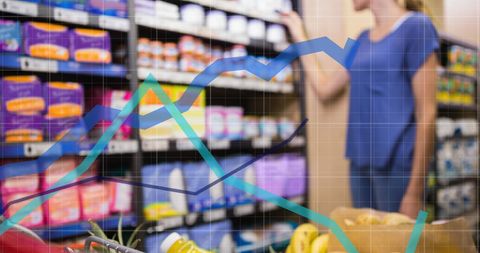
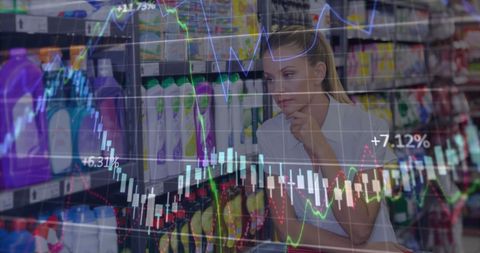
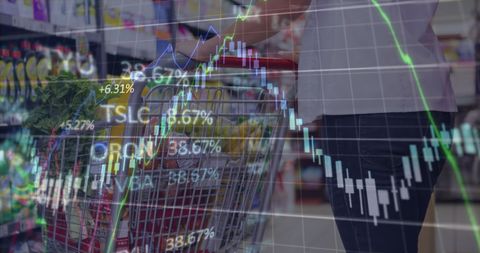
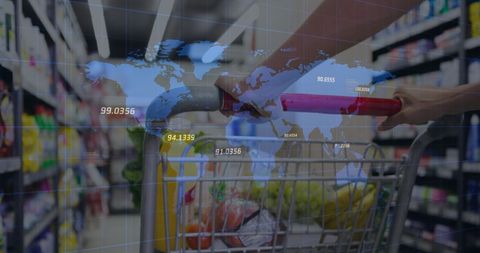
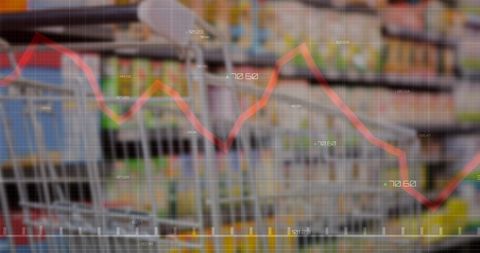
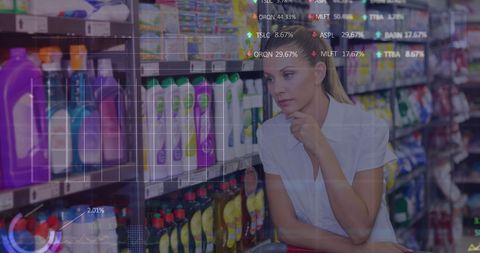
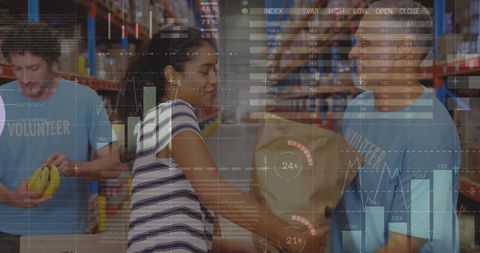
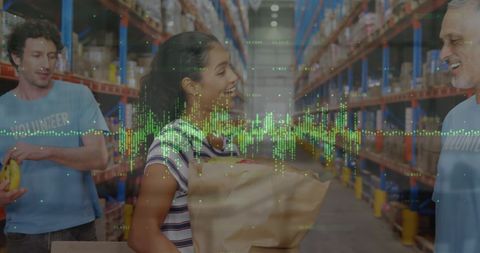
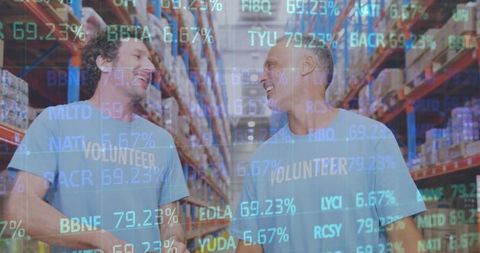
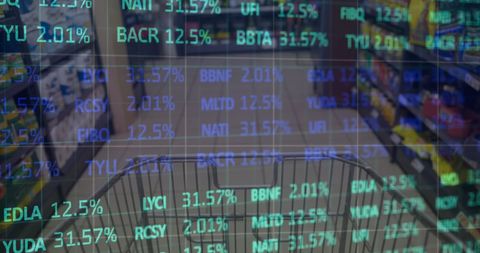
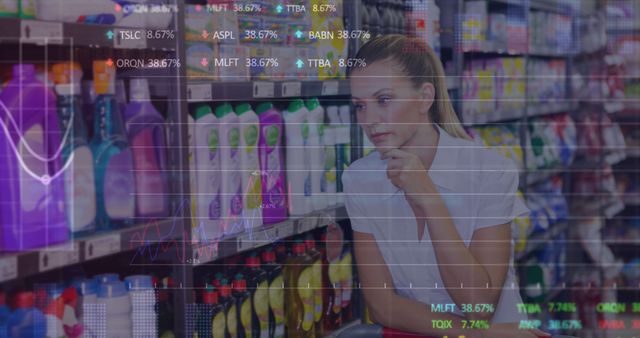
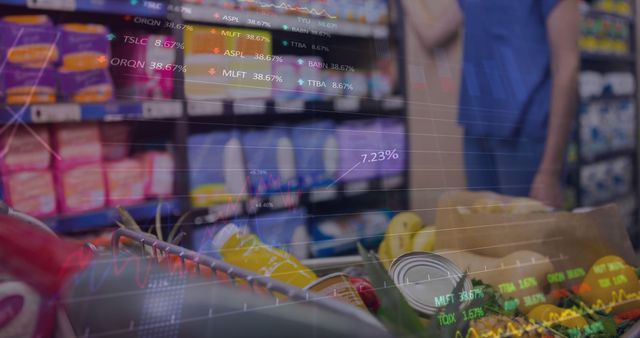
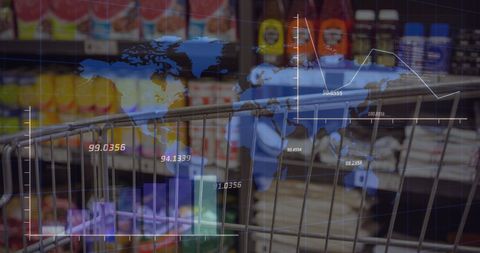
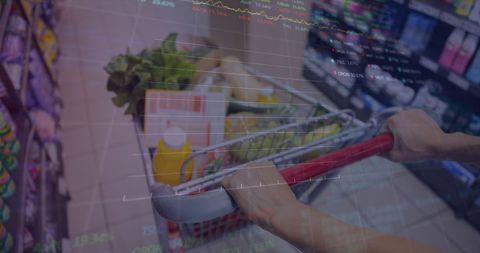
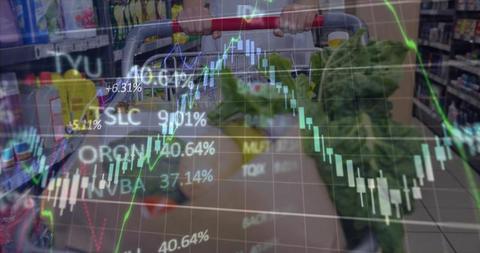
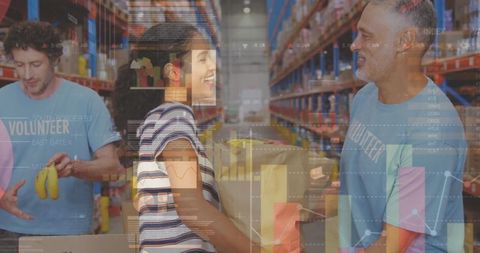
- Financial Analytics Overlay on Shopping Experience
Financial Analytics Overlay on Shopping Experience Image

Image shows financial data graphs superimposed over a filled shopping cart with various groceries. This visual represents a blend of business analytics with everyday consumer activity. Useful for illustrating concepts related to economic trends, retail analytics, market impact, or digital transformation in consumer behaviors.

downloads
Tags:
More
Credit Photo
If you would like to credit the Photo, here are some ways you can do so
Text Link
photo Link
<span class="text-link">
<span>
<a target="_blank" href=https://pikwizard.com/photo/financial-analytics-overlay-on-shopping-experience/93f007de6f7727ade07bc71b71caa04e/>PikWizard</a>
</span>
</span>
<span class="image-link">
<span
style="margin: 0 0 20px 0; display: inline-block; vertical-align: middle; width: 100%;"
>
<a
target="_blank"
href="https://pikwizard.com/photo/financial-analytics-overlay-on-shopping-experience/93f007de6f7727ade07bc71b71caa04e/"
style="text-decoration: none; font-size: 10px; margin: 0;"
>
<img src="https://pikwizard.com/pw/medium/93f007de6f7727ade07bc71b71caa04e.jpg" style="margin: 0; width: 100%;" alt="" />
<p style="font-size: 12px; margin: 0;">PikWizard</p>
</a>
</span>
</span>
Free (free of charge)
Free for personal and commercial use.
Author: Awesome Content