
- Home >
- Stock Photos >
- Financial Analytics Screen with Candlestick Charts and Data Visualization
Financial Analytics Screen with Candlestick Charts and Data Visualization Image
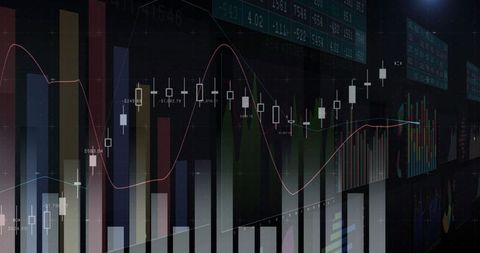
Displaying interactive financial data sets such as candlestick charts and bar graphs. Ideal for presentations or articles regarding stock market analysis, data visualization techniques in financial analytics, and trends in digital trading platforms. Useful for professionals in finance education, businesses promoting investment tools, or technology developers focused on creating trade interfaces.

downloads
Tags:
More
Credit Photo
If you would like to credit the Photo, here are some ways you can do so
Text Link
photo Link
<span class="text-link">
<span>
<a target="_blank" href=https://pikwizard.com/photo/financial-analytics-screen-with-candlestick-charts-and-data-visualization/6ee93c5a10ca1cb393d24e71920283e1/>PikWizard</a>
</span>
</span>
<span class="image-link">
<span
style="margin: 0 0 20px 0; display: inline-block; vertical-align: middle; width: 100%;"
>
<a
target="_blank"
href="https://pikwizard.com/photo/financial-analytics-screen-with-candlestick-charts-and-data-visualization/6ee93c5a10ca1cb393d24e71920283e1/"
style="text-decoration: none; font-size: 10px; margin: 0;"
>
<img src="https://pikwizard.com/pw/medium/6ee93c5a10ca1cb393d24e71920283e1.jpg" style="margin: 0; width: 100%;" alt="" />
<p style="font-size: 12px; margin: 0;">PikWizard</p>
</a>
</span>
</span>
Free (free of charge)
Free for personal and commercial use.
Author: Creative Art