- Home >
- Stock Photos >
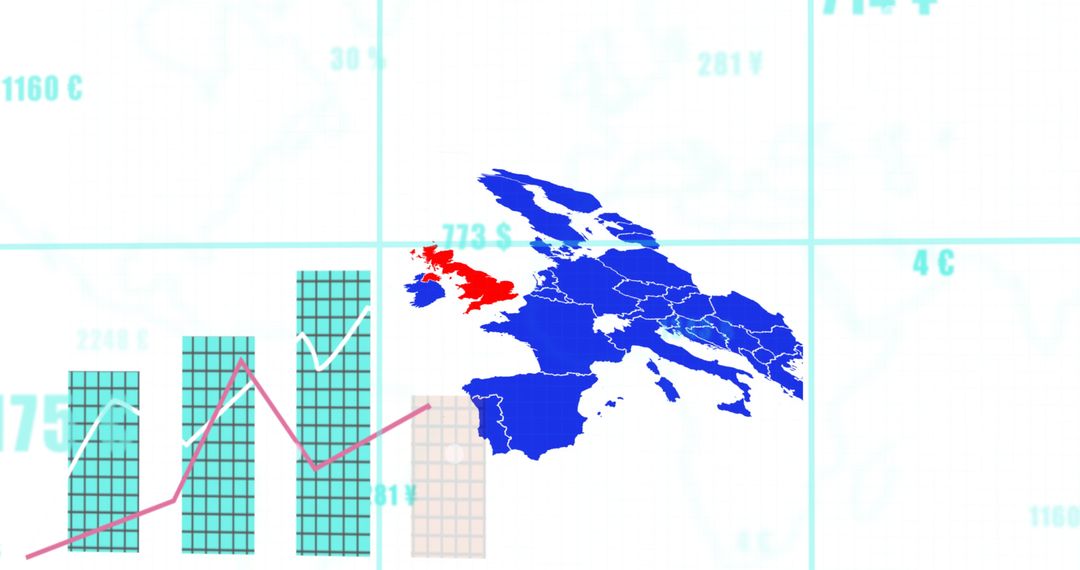
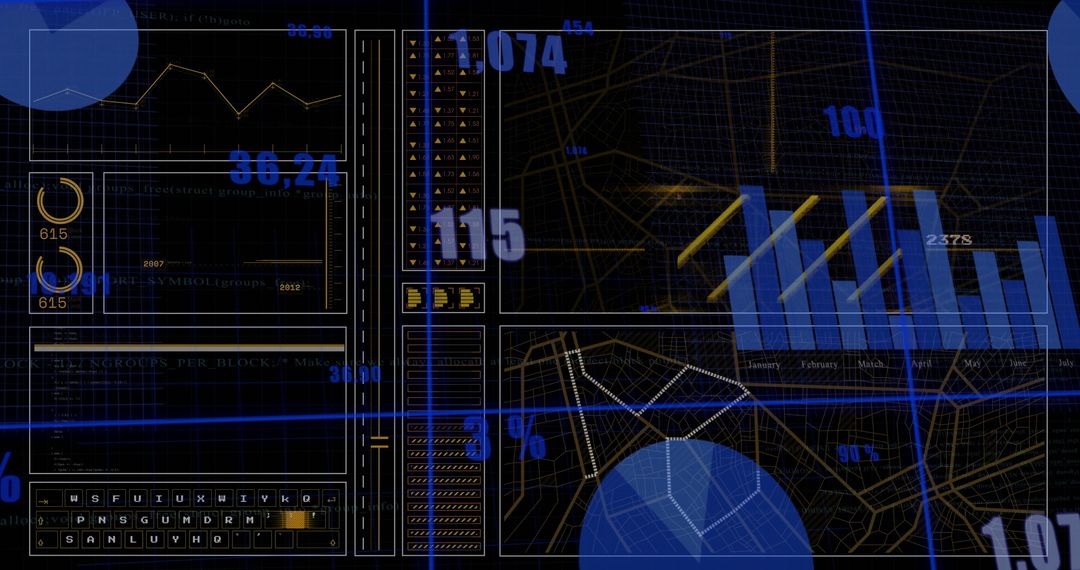
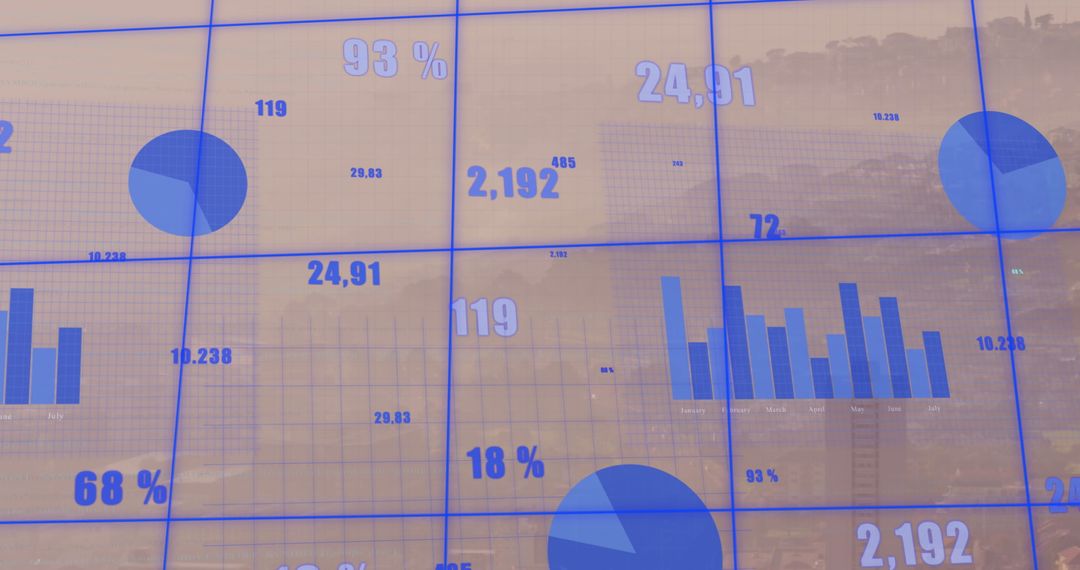
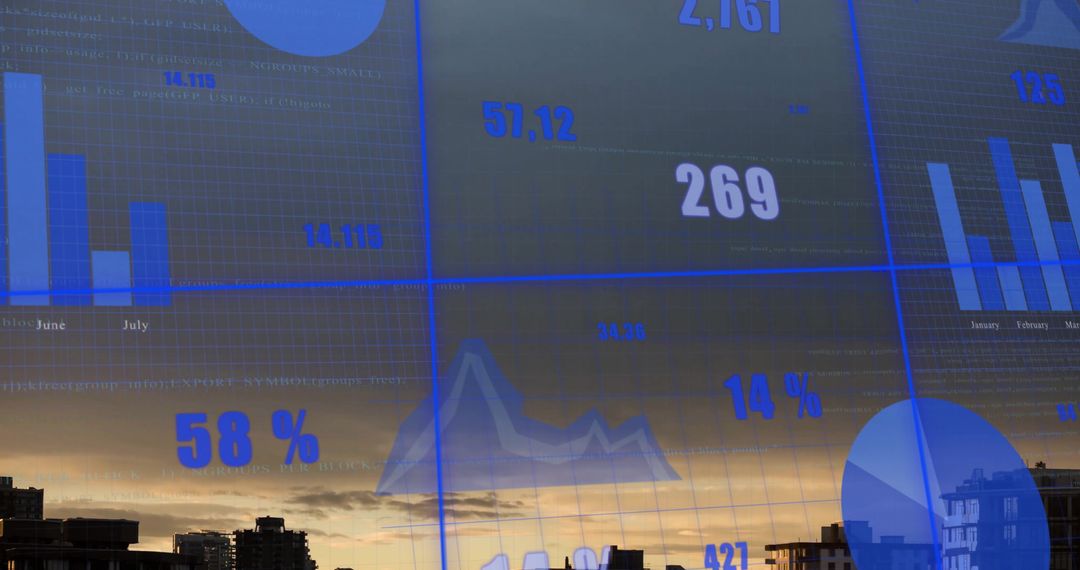
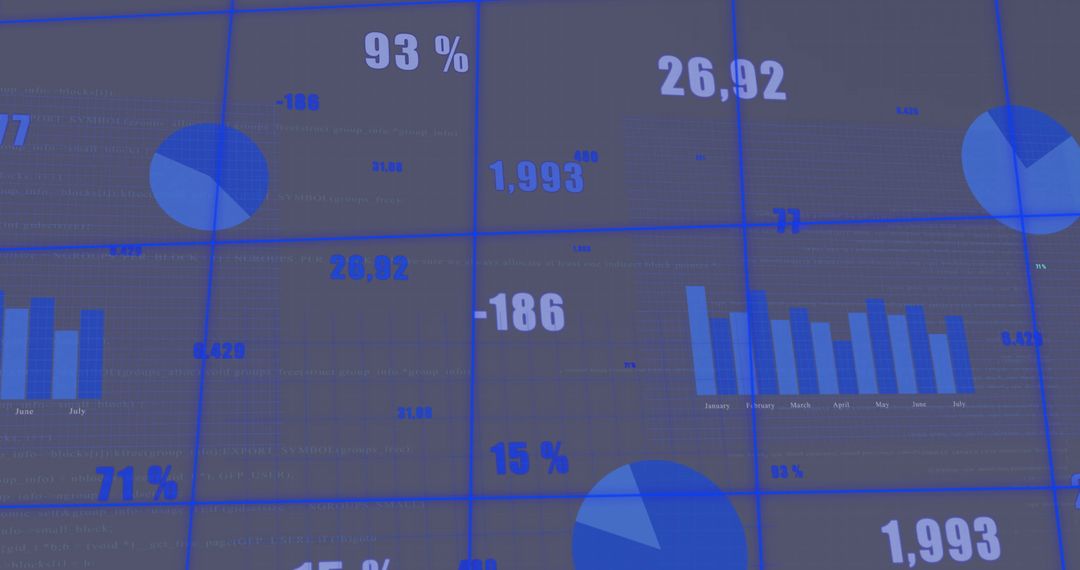
- Financial Analytics with Dark Grid and Data Visualizations
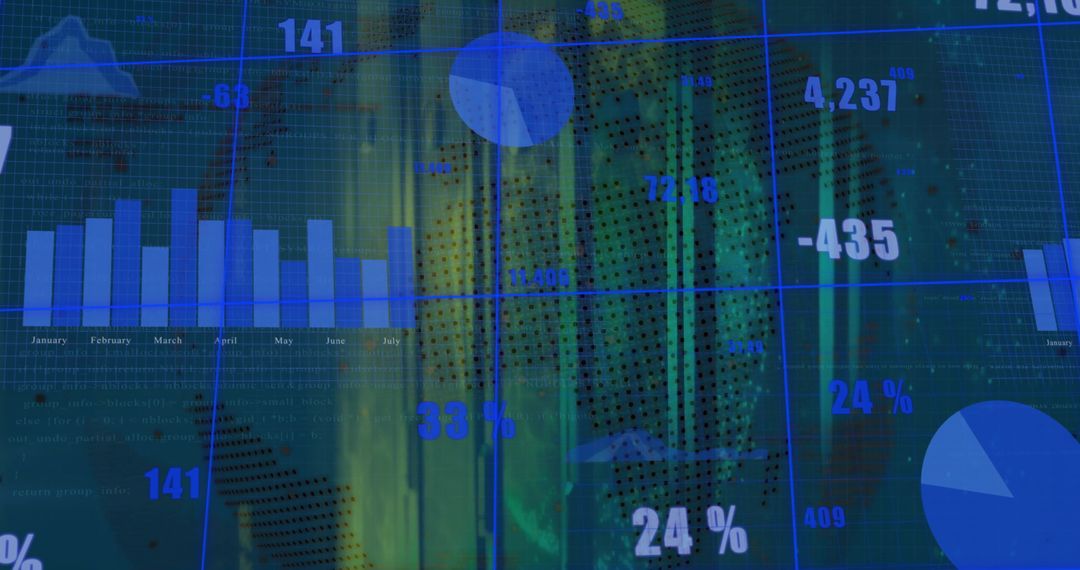
Financial Analytics with Dark Grid and Data Visualizations Image

Dark grid background with overlay of financial data charts, statistics, percentages indicating business financial trends and analytics. Bars, pie charts, and graphs express monetary analysis. Ideal for business presentations, financial reports, investment strategy guides, data-driven articles, or educational materials focusing on economics or technology.
Powered by 


2
downloads
downloads
Tags:
More
Credit Photo
If you would like to credit the Photo, here are some ways you can do so
Text Link
photo Link
<span class="text-link">
<span>
<a target="_blank" href=https://pikwizard.com/photo/financial-analytics-with-dark-grid-and-data-visualizations/5675977839c0231115885068a21f47e2/>PikWizard</a>
</span>
</span>
<span class="image-link">
<span
style="margin: 0 0 20px 0; display: inline-block; vertical-align: middle; width: 100%;"
>
<a
target="_blank"
href="https://pikwizard.com/photo/financial-analytics-with-dark-grid-and-data-visualizations/5675977839c0231115885068a21f47e2/"
style="text-decoration: none; font-size: 10px; margin: 0;"
>
<img src="https://pikwizard.com/pw/medium/5675977839c0231115885068a21f47e2.jpg" style="margin: 0; width: 100%;" alt="" />
<p style="font-size: 12px; margin: 0;">PikWizard</p>
</a>
</span>
</span>
Free (free of charge)
Free for personal and commercial use.
Author: People Creations
Similar Free Stock Images
Premium


Premium


Premium


Premium


Premium


Premium


Premium


Premium


Premium


Premium


Premium


Premium


Premium


Premium


Premium

Premium


Premium


Premium


Premium


Premium


Premium


Premium


Premium


Premium