1. Home > 
  2. Stock Photos > 
  3. Financial Analytics with Data Charts and Notetaking

Financial Analytics with Data Charts and Notetaking Image

Financial Analytics with Data Charts and Notetaking

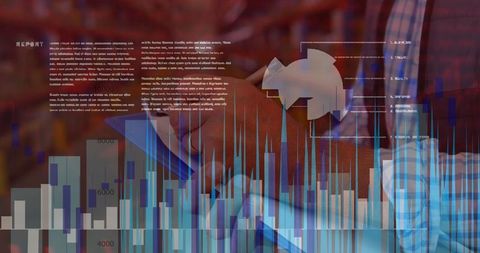
This image depicts a blend of financial data charts and a person taking notes on a clipboard, suggesting themes of financial analysis and global business. Ideal for illustrating financial reports, business presentations, and articles on economic trends.

Powered by Shutterstock logo - Get 15% off with code: PIKWIZARD15
Businesswomen use magnifier glass find stock in stock markets, uptrends, growth economics, business strategy development, and opportunities for investment, take profit from funds, Financial Analyst.  - Powered by Shutterstock - Get 15% off with code: PIKWIZARD15An analyst uses a computer and dashboard for data business analysis and Data Management System with KPI and metrics connected to the database for technology finance, operations, sales, marketing  - Powered by Shutterstock - Get 15% off with code: PIKWIZARD15Data science and big data technology. Scientist computing, analysing and visualizing complex data set on computer. Data mining, artificial intelligence, machine learning, business analytics. - Powered by Shutterstock - Get 15% off with code: PIKWIZARD15Analyst woman working with information database to analyze marketing and sales data. Business analytics dashboard with charts, metrics, and KPIs concept. - Powered by Shutterstock - Get 15% off with code: PIKWIZARD15Financial Expert Reviews Market Projections and Investment Strategies on Computer - Powered by Shutterstock - Get 15% off with code: PIKWIZARD15

Credit Photo

If you would like to credit the Photo, here are some ways you can do so

Free (free of charge)

Free for personal and commercial use.

Author: Authentic Images

Similar Free Stock Images

Financial Data Overlay on Team Brainstorming in Office
Premium
Businessman using KPI dashboard.Financial business KPI System data analytics graph dashboard.Data System KPI and metrics connected in database for follow earnings,operations and sales data.
Business Professionals Analyzing Virtual Data and Graphs in Modern Office
Global Trade and Finance in Industrial Warehouse Setting
Futuristic Warehouse Supply Chain Data Visualization
Warehouse Workers with Data Overlay Illustrating Global Shipping and Analytics
Premium
Male coach hold seminar for staff, makes presentation, provides sales statistics explanation gathered in modern conference room, with monitor screen with infographic charts, graphs and diagrams data
Business Professionals Analyzing Financial Data with Abstract Graphs
Rugby Player Overlay with Data Analytics and Sports Stats
Businesswoman Smiling Amidst Data Visualization in Modern Office
Global Data Visualization with Digital Interfaces and Scans
Premium
Online trading, Investment, Strategy market plan, and Stock mark
Mathematical Equations Overlaying Teacher Guiding Students
Warehouse Worker Analyzing Stock Data with Financial Graphs Overlay
Diverse Team Analyzing Stock Market Trends with Digital Data Overlay
Global Business Planning with Data Analytics and Binary Coding
Premium
Many charts and graphs. Reflection light and flare. Concept image of data gathering and statistical working.
Business Team Analyzing Financial Data and Stock Market Graphs
Confident Businesswoman Interacting with Digital Financial Data
Analytical African American Woman Analyzing Data on Tablet in Office
Global Business Finance Strategy with Data and Cityscape
Premium
Analyst woman working with information database to analyze marketing and sales data. Business analytics dashboard with charts, metrics, and KPIs concept.
Businessman Analyzing Financial Data and Technology Integration
Digital Sale Announcement with Futuristic Graphics
Abstract Futuristic Data and Communication Theme
Business Team Analyzing Financial Data with Virtual Infographics
Premium
Business people use computers to analyze business and manage corporate data, business analytics with charts, metrics and KPIs to improve organizational performance, financial organization strategy.
Modern Team Collaboration with Digital Analytics Overlay
Business Professionals Collaborating on Data Analysis with Digital Charts
Innovative Business Team Analyzing Data with Digital Charts Overlay
Team Collaborating with Holographic AR Data Interfaces in Office
Business Professionals Analyzing Virtual Data Graphics
Diverse Businesspeople Engaging with Digital Financial Data
Premium
Analysis finance grow graph and market  investment. Financial  business plan,earnings,sale and strategy. Stock market chart, exchange financial growth diagram.
Chef Cooking in Modern Kitchen with Interactive Displays
Analyzing Financial Data with Tablet Technology Integration
Data Processing with Global Shipping Concept in Warehouse
Businessman Analyzing Financial Data in Warehouse Concept
Premium
Analyst working with Financial Report and Business Analytics Dashboard on laptop computer to analyze Financial Data with KPI and Metrics. Investment, Operations, Sales, Corporate Finance, Strategy.
Volunteers Sorting Donations with Data Overlay in Warehouse
Business People Walking in Office with Financial Data Overlay
Global Logistics Network with Warehouse Workers and Data Overlay
Global Business Metrics with Financial Data Charts
Premium
Business Financing Accounting Banking Concept, Businesswoman doing finances and calculating financial report with business graph growth chart, finance and investment, business analysis concept
Data Processing Interface Over Female Eye with Digital Graphics
Global Business Analysis and Teamwork with Financial Data
Financial Professionals Analyzing Digital Data with Global Finance Overlay
Financial Trading Concepts with Diverse Colleagues Discussing Data
Premium
Big data technology and data science with person touching data flowing on virtual screen. Business analytics, artificial intelligence, machine learning. Engineer or scientist analyzing stream of data.
Virtual Data Visualization Enhancing Business Communication
Business Collaboration and Digital Analytics with Cityscape Overlay
Businesswoman Analyzing Financial Graphs on Tablet Interface
Coworkers Analyzing Data with Digital Interface in Modern Office
Premium
Businessman using laptop computer analyzing sales data and financial growth graph chart report. Business planning, strategy and development. Financial accounting. market research, data analysis
Digital Finance Overview Above Cafe Environment
Digital Interface with Globe and Data Visualizations
Businesswoman Analyzing Data with Smartphone Holographic Interface
Futuristic Data Center with Overlaid Digital Data and Graphics
Premium
Stock exchange market traders investors working on financial trading charts analysis. Two happy busy business men analysts consulting on digital finance forecast using laptop in office. Copy space.
Software Developers Reviewing Code on Modern Workstation
Professional Analyzing Data Amidst Financial Charts Overlay
Business Professional Analyzing Data on Sticky Notes in Office
Technological Financial Analysis on the Move
Financial Data Analytics With Businessman in Modern Office
Warehouse Supervisors Analyzing Stock with Technological Overlay
Premium
businessman working data document graph chart report marketing research development  planning management strategy analysis financial accounting. Business  office concept.
Data Code Overlapping Server Room with Digital Technology Interface
Industrial and Finance Sector Overlay with Stock Market Graphs
Collaborative Financial Analysis in Urban Business Environment
Abstract Financial Data Superimposed on Urban Skyline
Premium
Data analysis, business meeting or woman with graph presentation in office for revenue, profit or sale statistics. Chart, analytics or accounting mentor brainstorming economy, inflation or solution
Woman in VR Headset Analyzing Data with Holographic Graphs
Warehouse Worker Checking Inventory with Stock Market Graph Overlay
Businesswoman Engaged Overlapping Data Dashboard in Modern Office
Digital Finance Overlay on Warehouse Workers Analyzing Data Visualization
Premium
Financial advisor explaining invest stock market data consulting investor. Two busy business men analysts doing finance trading analysis pointing at exchange chart on laptop screen working in office.
Diverse Business Team Analyzing Global Data Charts
Diverse Team Analyzing Global Financial Data with Stock Market Graphics
Financial Analysis and Global Market Strategies Concept
Business People Analyzing Data with Futuristic Graphics
Premium
Stock market or forex trading graph on touchscreen,  finance and investment concept. Economy trends for business, financial charts and digits.
Business Team Analyzing Financial Graphs in Urban Office
Businesswoman Analyzing Financial Data on Tablet Technology Overlay
Diverse Colleagues Analyzing Data in Modern Office with Digital Interface
Business Analytics Meeting with Diverse Team and Global Data Projections
Premium
Business finance data analytics graph.Financial management technology.Advisor using KPI Dashboard on virtual screen.
Innovative Warehouse Management with Data Analysis
Global Business Overlay with Diverse Team Collaborating
Worker in Warehouse with Global Digital Overlay Representing Supply Chain Connectivity
Business Team Analyzing Digital Analytics in Modern Office
Premium
Business man trader investor analyst using mobile phone app analytics for cryptocurrency financial market analysis, trading data index chart graph on smartphone and laptop screen. Over shoulder view
Professional Analyst Interacting with Holographic Data in Modern Office
Analysts Examining Data Visualizations and Code Overlays in Modern Lab
Diverse Team Discussing Data Analytics with Technology Overlays
Businessman Analyzing Data with Digital Charts Overlay
Businesswoman Analyzing Digital Financial Data Overlay
Digital Innovation and Reporting in Technology
Premium
Finance analyst working on business analytics and data management system to make financial report with business performance, KPI dashboard. Corporate strategy for finance, digital marketing plan
Global Finance Concept with Delivery Man and Data Overlays
Colleagues Analyzing Financial Data with Technological Overlays
Data Analytics in Rugby with Graphic Interface Overlay
Warehouse Workers with Financial Data Display Overlay
Premium
Professional analyzing financial data graphs, charts on laptop display at a modern workspace. Financial analysis or business evaluation concept
Financial Data Analysis with Diverse Business Team in Modern Office Setting
Global Financial Analysis with Team Collaboration and Data Visualization
Augmented Reality Interface with Warehouse Worker Analyzing Data
Abstract Financial Data Concept with Businesspeople in Motion
Premium
Analytics Finance and Business concept. Big data analytics and business intelligence BI.
Diverse Business People Analyzing Stock Market Data Overlay
Business Team Analyzing Digital Financial and Stock Market Data
Innovative Businessman Analyzing Data on Smartphone
Business Seminar with Holographic Data Projections
Premium
Analytical data and development statistics. Web analytics and product testing techniques are being measured. A guy studies an SEO dashboard and a digital report.
Diverse Professionals Analyzing Data with Overlay of Digital Graphs
Digital Analysis with Data Overlay and Business Professions
Diverse Team Collaborating on Data Analysis with Graph Overlays
Digital Financial Analysis with Trend Charts and Data
Premium
Big data technology and data science. Data scientist querying, analysing and visualizing complex set on virtual screen. Data flow concept. Neural network, artificial intelligence, ML, analytics.
Caucasian Female Doctor with Digital Data Visions
Engineer Analyzing Holographic Code in High-Tech Lab
Digital Blueprint Review on Tablet in Contemporary Living Room
Creative Collaboration and Data Analysis in Modern Office
Premium
Businessman using digital tablet analyzing sales data and financial growth graph chart report. Business planning, strategy and development. Financial and banking. market research, business analysis
Man Relaxing on Sofa with Digital Tablet Showing Business Charts