- Home >
- Stock Photos >
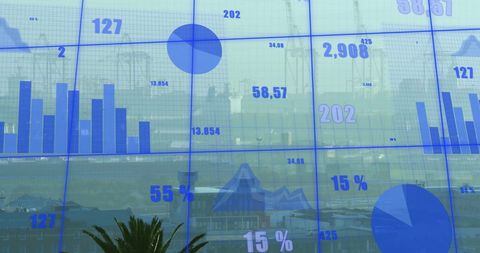
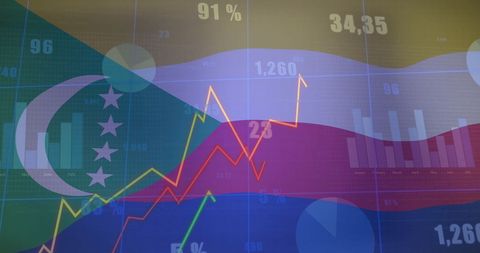
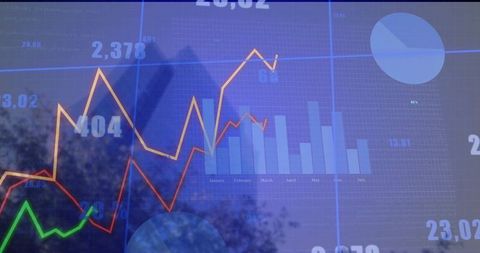
- Financial Analytics with Graphs and Data on Digital Interface
Financial Analytics with Graphs and Data on Digital Interface Image

Abstract image illustrating financial analytics with various data points, graphs, and charts on a digital blueprint background. Shows numerical data for potential use in illustrating business presentations, economic trends, technological advancements, or investment opportunities. Perfect for any digital representation of financial activities, global trade, or market analysis materials.

downloads
Tags:
More
Credit Photo
If you would like to credit the Photo, here are some ways you can do so
Text Link
photo Link
<span class="text-link">
<span>
<a target="_blank" href=https://pikwizard.com/photo/financial-analytics-with-graphs-and-data-on-digital-interface/6eef672372aef4e951bc8c4cd8afc67a/>PikWizard</a>
</span>
</span>
<span class="image-link">
<span
style="margin: 0 0 20px 0; display: inline-block; vertical-align: middle; width: 100%;"
>
<a
target="_blank"
href="https://pikwizard.com/photo/financial-analytics-with-graphs-and-data-on-digital-interface/6eef672372aef4e951bc8c4cd8afc67a/"
style="text-decoration: none; font-size: 10px; margin: 0;"
>
<img src="https://pikwizard.com/pw/medium/6eef672372aef4e951bc8c4cd8afc67a.jpg" style="margin: 0; width: 100%;" alt="" />
<p style="font-size: 12px; margin: 0;">PikWizard</p>
</a>
</span>
</span>
Free (free of charge)
Free for personal and commercial use.
Author: Awesome Content