- Home >
- Stock Photos >
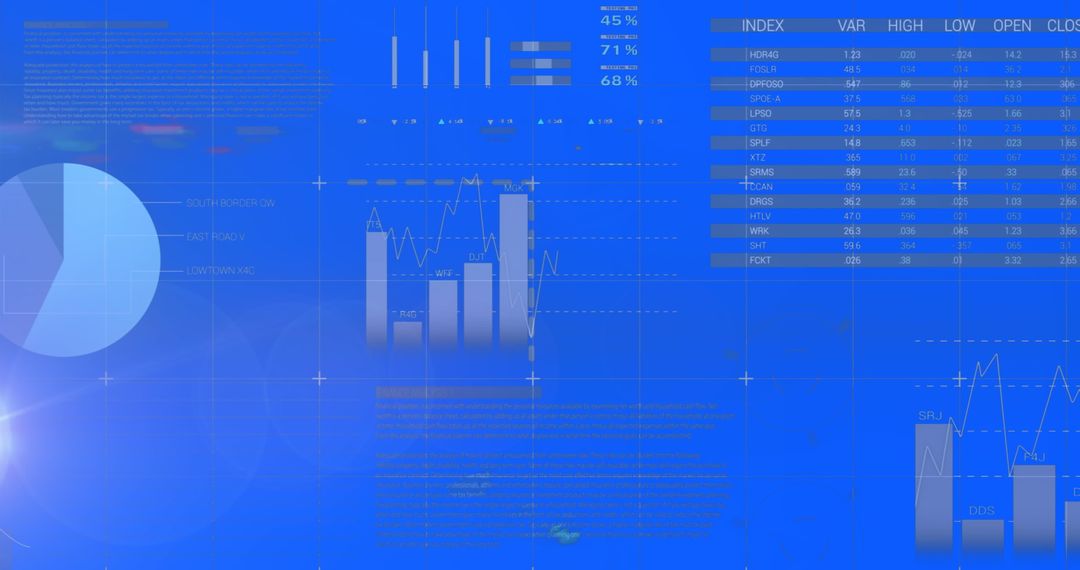
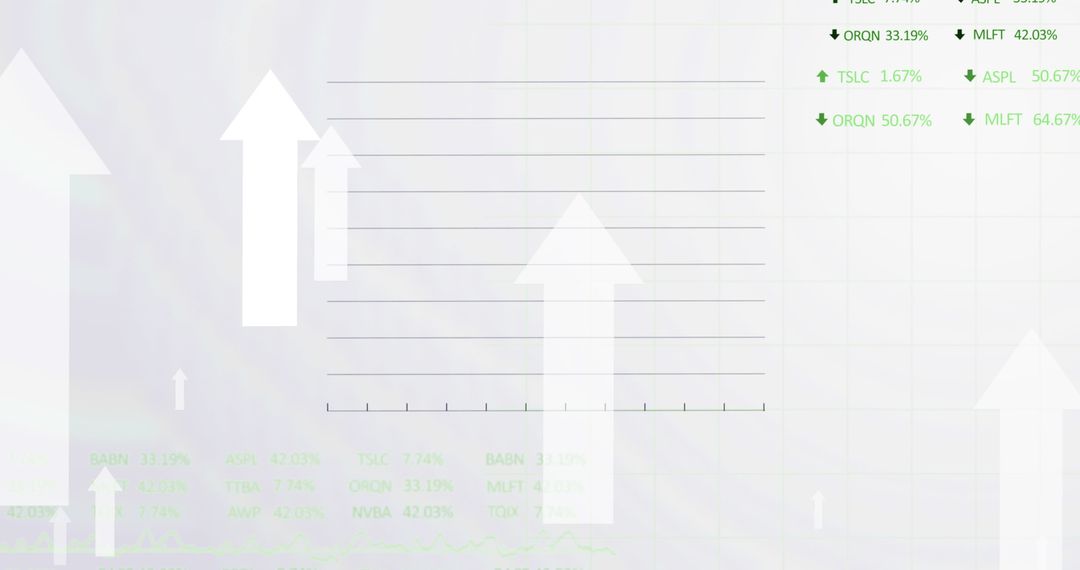
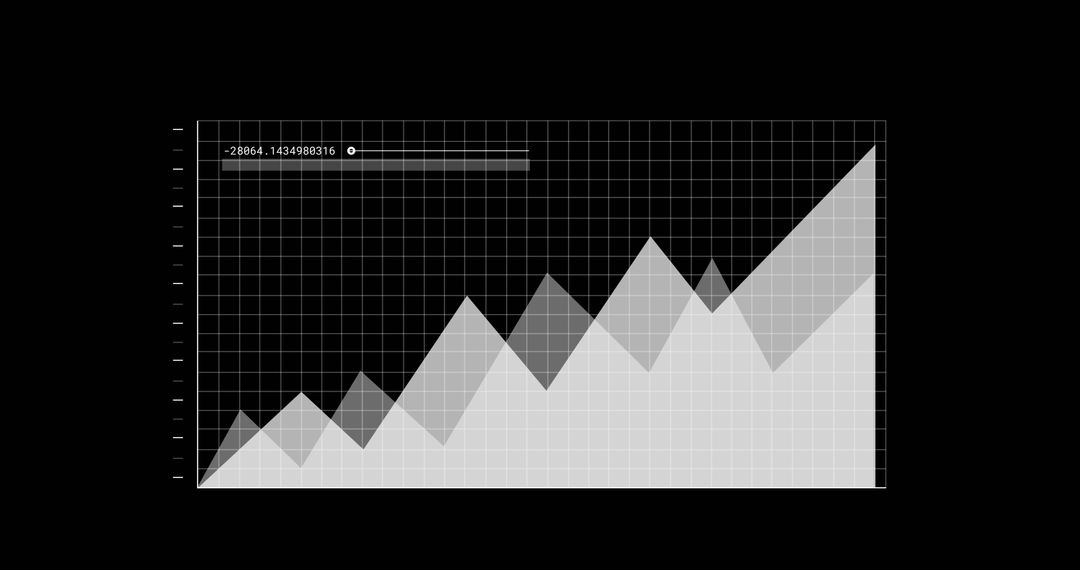
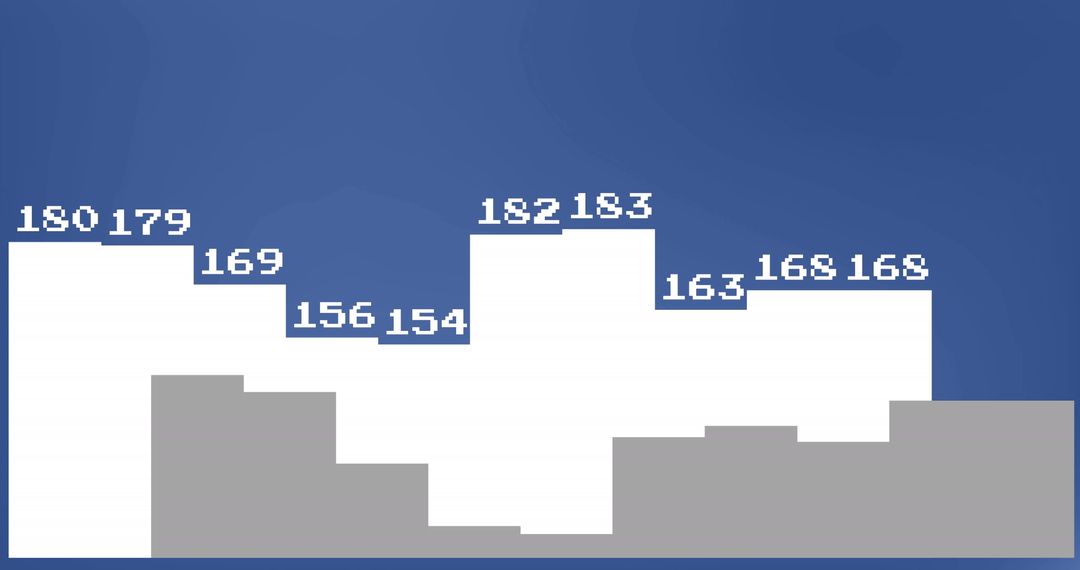
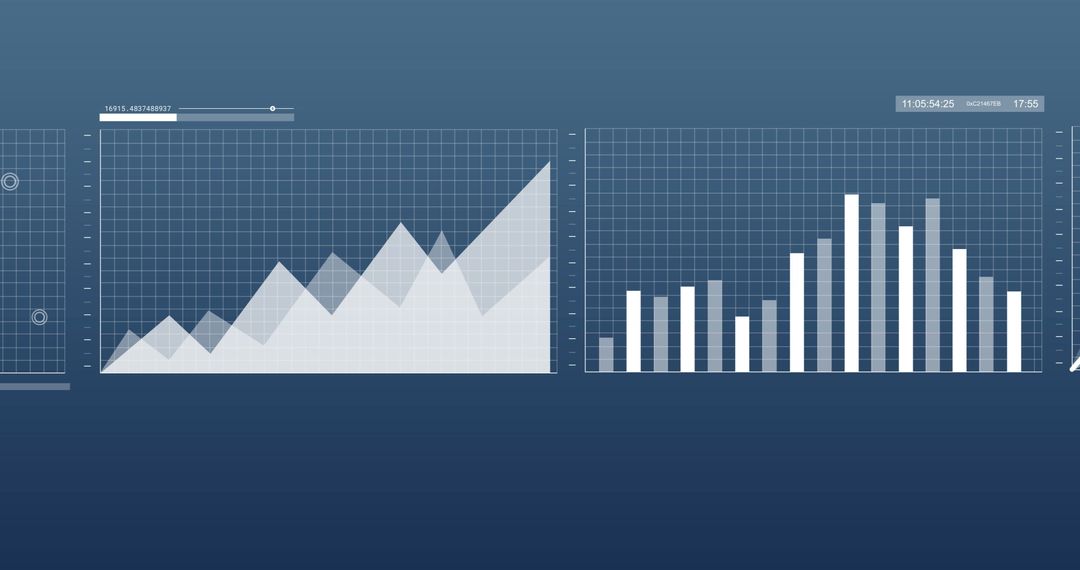
- Financial Analytics with Graphs and Pie Chart on Blue Background
Financial Analytics with Graphs and Pie Chart on Blue Background Image

Visualizing financial data with interactive graphs and pie chart highlights economic growth and business trends. Skyline-like line chart demonstrates analytics and statistical information, suitable for presentations, financial reports, data analysis tools, and online business contents focusing on economic overviews and financial insights.
Powered by  - Get 15% off with code: PIKWIZARD15


0
downloads
downloads
Tags:
More
Credit Photo
If you would like to credit the Photo, here are some ways you can do so
Text Link
photo Link
<span class="text-link">
<span>
<a target="_blank" href=https://pikwizard.com/photo/financial-analytics-with-graphs-and-pie-chart-on-blue-background/e0a1b9e0080096783e70ead8b8c6bfa7/>PikWizard</a>
</span>
</span>
<span class="image-link">
<span
style="margin: 0 0 20px 0; display: inline-block; vertical-align: middle; width: 100%;"
>
<a
target="_blank"
href="https://pikwizard.com/photo/financial-analytics-with-graphs-and-pie-chart-on-blue-background/e0a1b9e0080096783e70ead8b8c6bfa7/"
style="text-decoration: none; font-size: 10px; margin: 0;"
>
<img src="https://pikwizard.com/pw/medium/e0a1b9e0080096783e70ead8b8c6bfa7.jpg" style="margin: 0; width: 100%;" alt="" />
<p style="font-size: 12px; margin: 0;">PikWizard</p>
</a>
</span>
</span>
Free (free of charge)
Free for personal and commercial use.
Author: Awesome Content
Similar Free Stock Images

Premium


Premium


Premium


Premium


Premium


Premium


Premium


Premium


Premium


Premium


Premium


Premium


Premium


Premium


Premium


Premium


Premium


Premium


Premium


Premium


Premium


Premium


Premium


Premium