- Home >
- Stock Photos >
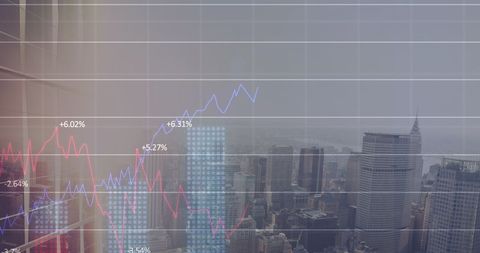
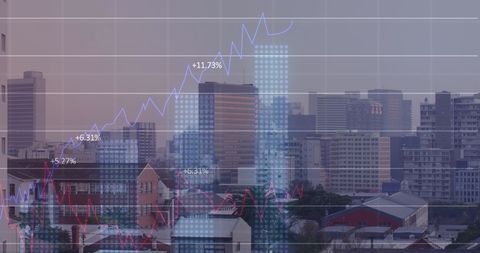
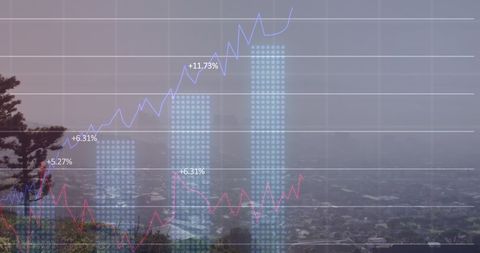
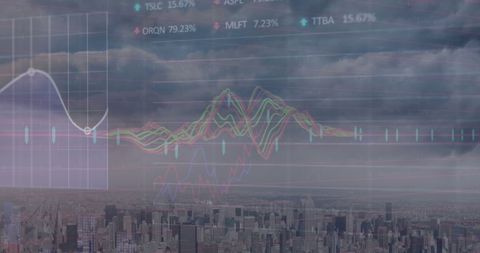
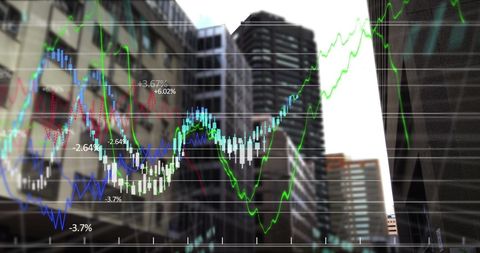
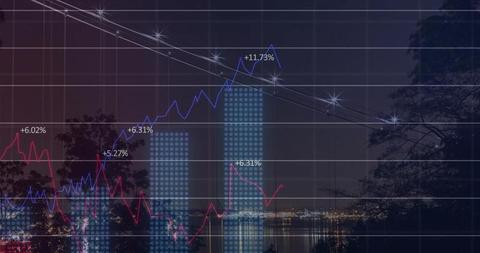
- Financial Analytics with Rising Graphs and Urban Skyline
Financial Analytics with Rising Graphs and Urban Skyline Image

Illustrating digital financial data processing with graphs indicating market trends superimposed over a cityscape. Suitable for economic reports, stock market analysis, business growth presentations, and finance-related marketing materials.
Powered by  - Get 15% off with code: PIKWIZARD15


2
downloads
downloads
Tags:
More
Credit Photo
If you would like to credit the Photo, here are some ways you can do so
Text Link
photo Link
<span class="text-link">
<span>
<a target="_blank" href=https://pikwizard.com/photo/financial-analytics-with-rising-graphs-and-urban-skyline/76089b3fd9fd368bd5ce5d3892f1b9c1/>PikWizard</a>
</span>
</span>
<span class="image-link">
<span
style="margin: 0 0 20px 0; display: inline-block; vertical-align: middle; width: 100%;"
>
<a
target="_blank"
href="https://pikwizard.com/photo/financial-analytics-with-rising-graphs-and-urban-skyline/76089b3fd9fd368bd5ce5d3892f1b9c1/"
style="text-decoration: none; font-size: 10px; margin: 0;"
>
<img src="https://pikwizard.com/pw/medium/76089b3fd9fd368bd5ce5d3892f1b9c1.jpg" style="margin: 0; width: 100%;" alt="" />
<p style="font-size: 12px; margin: 0;">PikWizard</p>
</a>
</span>
</span>
Free (free of charge)
Free for personal and commercial use.
Author: Creative Art
Similar Free Stock Images

Premium


Premium


Premium


Premium


Premium


Premium


Premium


Premium


Premium


Premium


Premium


Premium


Premium


Premium


Premium


Premium


Premium


Premium


Premium


Premium


Premium


Premium


Premium


Premium


Premium