
- Home >
- Stock Photos >
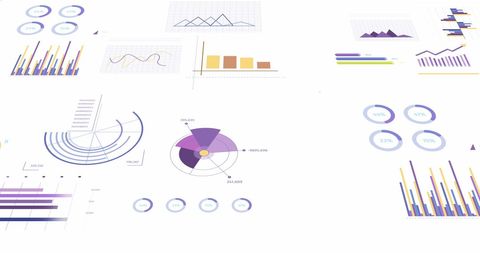
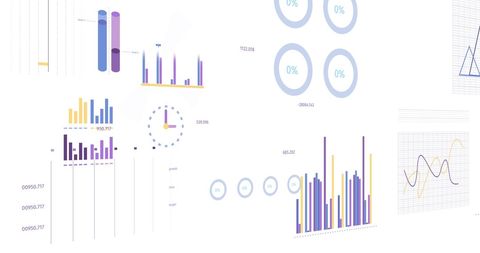
- Financial and Statistical Data Visualization Concept
Financial and Statistical Data Visualization Concept Image
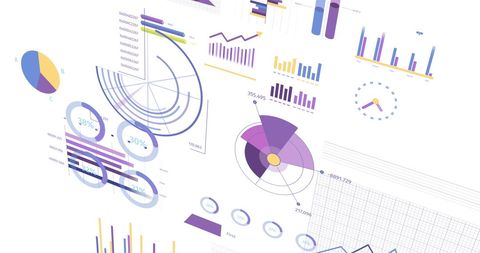
This digitally generated graphic features various charts and graphs in a minimalist and futuristic setting. Ideal for presentations, websites, and educational materials discussing data analysis, financial trends, or technology in business. The imagery conveys a sense of precision and analytical rigor suited for projects related to statistical analysis or reporting.
Powered by 


downloads
Tags:
More
Credit Photo
If you would like to credit the Photo, here are some ways you can do so
Text Link
photo Link
<span class="text-link">
<span>
<a target="_blank" href=https://pikwizard.com/photo/financial-and-statistical-data-visualization-concept/1926204c69878b8c83b261849669a9a4/>PikWizard</a>
</span>
</span>
<span class="image-link">
<span
style="margin: 0 0 20px 0; display: inline-block; vertical-align: middle; width: 100%;"
>
<a
target="_blank"
href="https://pikwizard.com/photo/financial-and-statistical-data-visualization-concept/1926204c69878b8c83b261849669a9a4/"
style="text-decoration: none; font-size: 10px; margin: 0;"
>
<img src="https://pikwizard.com/pw/medium/1926204c69878b8c83b261849669a9a4.jpg" style="margin: 0; width: 100%;" alt="" />
<p style="font-size: 12px; margin: 0;">PikWizard</p>
</a>
</span>
</span>
Free (free of charge)
Free for personal and commercial use.
Author: Authentic Images
Similar Free Stock Images

Premium


Premium


Premium


Premium


Premium

Premium

Premium

Premium


Premium

Premium


Premium

Premium

Premium


Premium

Premium

Premium


Premium

Premium


Premium


Premium


Premium


Premium


Premium

Premium


Premium


Explore More Free Stock Images