
- Home >
- Stock Photos >
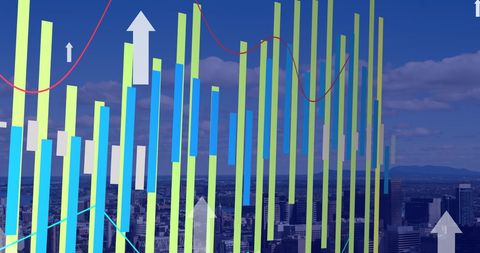
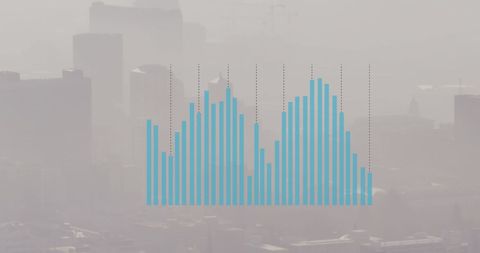
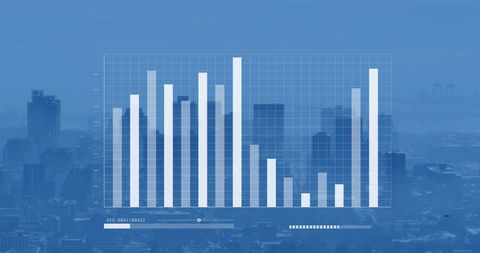
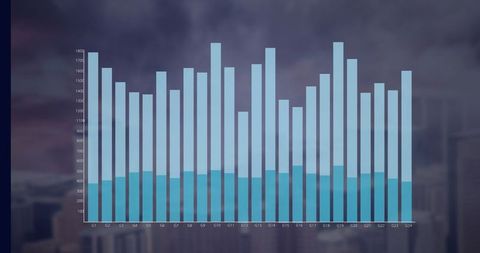
- Financial Bar Graph Overlapping Modern City Skyline
Financial Bar Graph Overlapping Modern City Skyline Image

Bar graph in foreground with overlapping city skyline emphasizes business analytics, data insights, and financial growth strategies. Useful for presentations on global markets, engaging slideshows, and articles related to urban economics or corporate finance.
Powered by  - Get 15% off with code: PIKWIZARD15


2
downloads
downloads
Tags:
More
Credit Photo
If you would like to credit the Photo, here are some ways you can do so
Text Link
photo Link
<span class="text-link">
<span>
<a target="_blank" href=https://pikwizard.com/photo/financial-bar-graph-overlapping-modern-city-skyline/97f14aa098847a4276805e63821b8b40/>PikWizard</a>
</span>
</span>
<span class="image-link">
<span
style="margin: 0 0 20px 0; display: inline-block; vertical-align: middle; width: 100%;"
>
<a
target="_blank"
href="https://pikwizard.com/photo/financial-bar-graph-overlapping-modern-city-skyline/97f14aa098847a4276805e63821b8b40/"
style="text-decoration: none; font-size: 10px; margin: 0;"
>
<img src="https://pikwizard.com/pw/medium/97f14aa098847a4276805e63821b8b40.jpg" style="margin: 0; width: 100%;" alt="" />
<p style="font-size: 12px; margin: 0;">PikWizard</p>
</a>
</span>
</span>
Free (free of charge)
Free for personal and commercial use.
Author: People Creations
Similar Free Stock Images
Loading...

Premium


Premium


Premium

Premium

Premium


Premium

Premium


Premium

Premium


Premium


Premium

Premium


Premium


Premium
Premium


Premium

Premium


Premium


Premium


Premium

Premium


Premium

Premium


Premium


Premium

