- Home >
- Stock Photos >
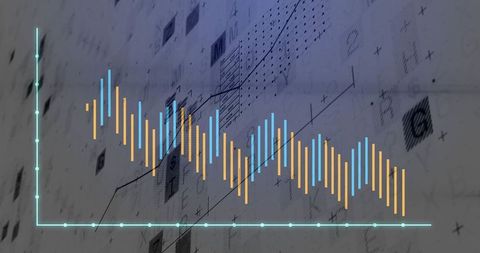
- Financial Chart Analysis and Data Visualization Concept
Financial Chart Analysis and Data Visualization Concept Image

Dynamic display of financial charts and statistical graphs overlaid on digital grid. Vivid bars and lines indicate market trends and analytical data. Ideal for illustrating economic reports, financial articles, presentations on data analytics and business growth strategies, or educational materials on finance.

downloads
Tags:
More
Credit Photo
If you would like to credit the Photo, here are some ways you can do so
Text Link
photo Link
<span class="text-link">
<span>
<a target="_blank" href=https://pikwizard.com/photo/financial-chart-analysis-and-data-visualization-concept/18d2116a6ad6c30f2cc87b74c3293f90/>PikWizard</a>
</span>
</span>
<span class="image-link">
<span
style="margin: 0 0 20px 0; display: inline-block; vertical-align: middle; width: 100%;"
>
<a
target="_blank"
href="https://pikwizard.com/photo/financial-chart-analysis-and-data-visualization-concept/18d2116a6ad6c30f2cc87b74c3293f90/"
style="text-decoration: none; font-size: 10px; margin: 0;"
>
<img src="https://pikwizard.com/pw/medium/18d2116a6ad6c30f2cc87b74c3293f90.jpg" style="margin: 0; width: 100%;" alt="" />
<p style="font-size: 12px; margin: 0;">PikWizard</p>
</a>
</span>
</span>
Free (free of charge)
Free for personal and commercial use.
Author: Authentic Images