- Home >
- Stock Photos >
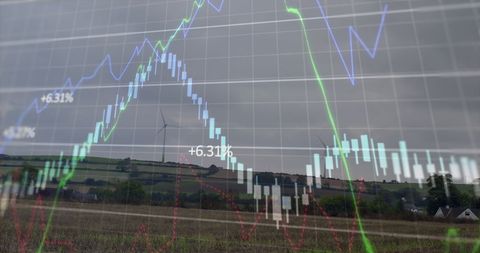
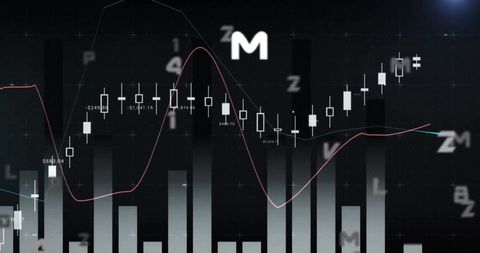
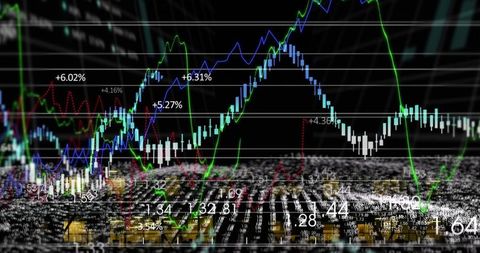
- Financial Chart Analysis with Market Data Visuals on Black Background
Financial Chart Analysis with Market Data Visuals on Black Background Image

Dynamic display of financial charts with numbers, graphs, and data showing fluctuations in the market. Ideal for illustrating concepts in global finance, economic analytics, and technology presentations or reports on business performance and market trends.
Powered by 


downloads
Tags:
More
Credit Photo
If you would like to credit the Photo, here are some ways you can do so
Text Link
photo Link
<span class="text-link">
<span>
<a target="_blank" href=https://pikwizard.com/photo/financial-chart-analysis-with-market-data-visuals-on-black-background/58294c100730ddf1fa8897d2d908bfe5/>PikWizard</a>
</span>
</span>
<span class="image-link">
<span
style="margin: 0 0 20px 0; display: inline-block; vertical-align: middle; width: 100%;"
>
<a
target="_blank"
href="https://pikwizard.com/photo/financial-chart-analysis-with-market-data-visuals-on-black-background/58294c100730ddf1fa8897d2d908bfe5/"
style="text-decoration: none; font-size: 10px; margin: 0;"
>
<img src="https://pikwizard.com/pw/medium/58294c100730ddf1fa8897d2d908bfe5.jpg" style="margin: 0; width: 100%;" alt="" />
<p style="font-size: 12px; margin: 0;">PikWizard</p>
</a>
</span>
</span>
Free (free of charge)
Free for personal and commercial use.
Author: Creative Art
Similar Free Stock Images
Loading...

Premium


Premium


Premium


Premium


Premium


Premium


Premium

Premium


Premium


Premium


Premium


Premium


Premium

Premium

Premium


Premium


Premium


Premium


Premium


Premium


Premium


Premium


Premium


Premium

Premium