
- Home >
- Stock Photos >
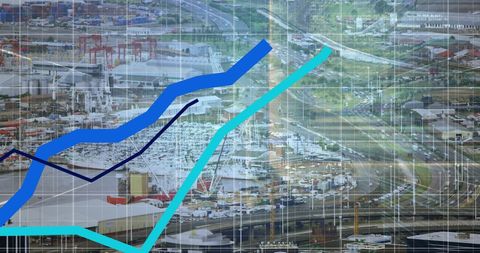
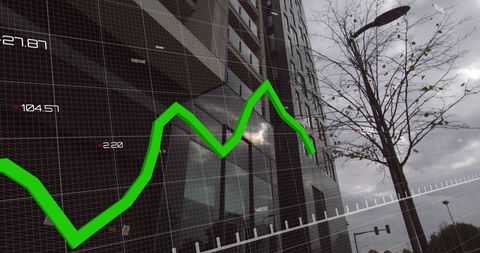
- Financial Chart Overlay on Office Building Facade
Financial Chart Overlay on Office Building Facade Image
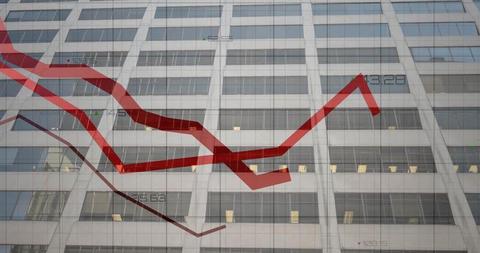
Illustrates the concept of business and economic data analysis with a financial chart graphically overlaid on an urban office building facade. Useful for editorial content concerning finance, economics, stock markets, or technological innovations in business spaces. It presents an insightful visualization for articles, blogs, or websites focused on market analysis or economy-related content.
Powered by 


2
downloads
downloads
Tags:
More
Credit Photo
If you would like to credit the Photo, here are some ways you can do so
Text Link
photo Link
<span class="text-link">
<span>
<a target="_blank" href=https://pikwizard.com/photo/financial-chart-overlay-on-office-building-facade/dd6b69d48fefd4f448734563fe33484b/>PikWizard</a>
</span>
</span>
<span class="image-link">
<span
style="margin: 0 0 20px 0; display: inline-block; vertical-align: middle; width: 100%;"
>
<a
target="_blank"
href="https://pikwizard.com/photo/financial-chart-overlay-on-office-building-facade/dd6b69d48fefd4f448734563fe33484b/"
style="text-decoration: none; font-size: 10px; margin: 0;"
>
<img src="https://pikwizard.com/pw/medium/dd6b69d48fefd4f448734563fe33484b.jpg" style="margin: 0; width: 100%;" alt="" />
<p style="font-size: 12px; margin: 0;">PikWizard</p>
</a>
</span>
</span>
Free (free of charge)
Free for personal and commercial use.
Author: Authentic Images
Similar Free Stock Images
Loading...

Premium


Premium


Premium


Premium


Premium


Premium

Premium


Premium


Premium


Premium


Premium

Premium


Premium

Premium

Premium


Premium


Premium

Premium


Premium


Premium


Premium


Premium


Premium


Premium


Premium
