- Home >
- Stock Photos >
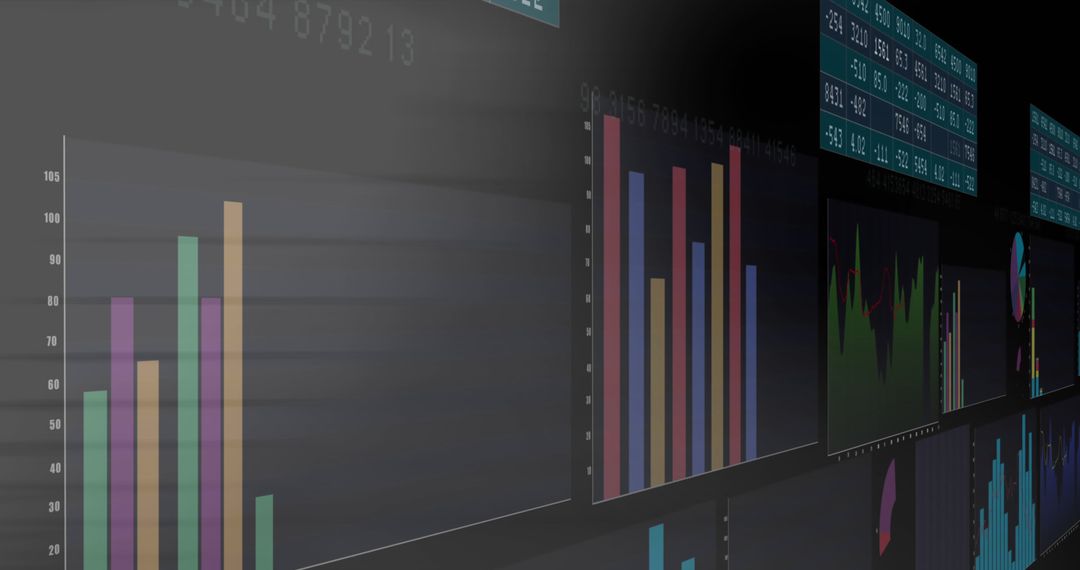
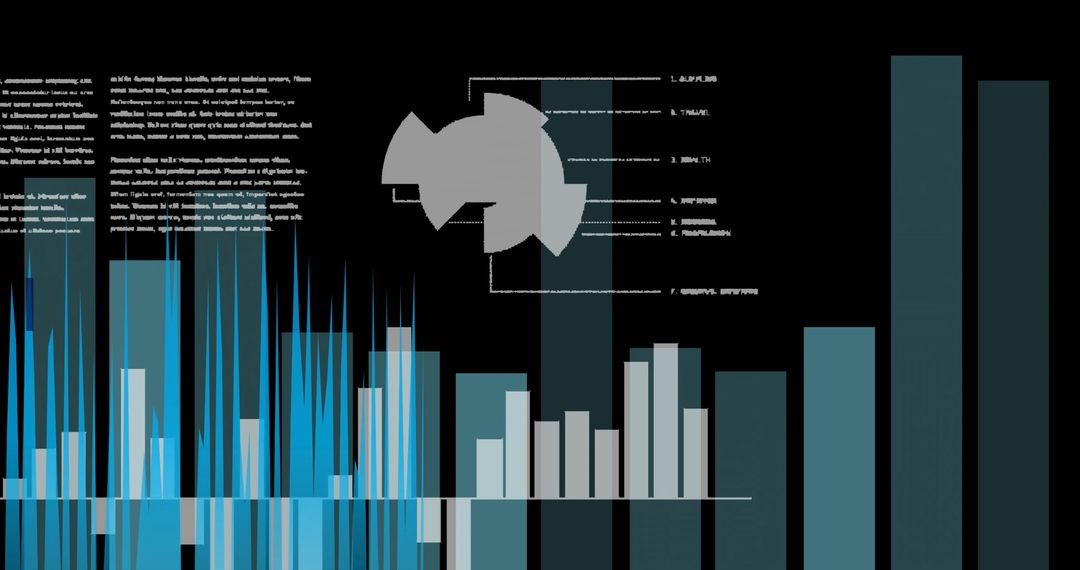
- Financial Chart Overlay with Notebook and Coffee
Financial Chart Overlay with Notebook and Coffee Image
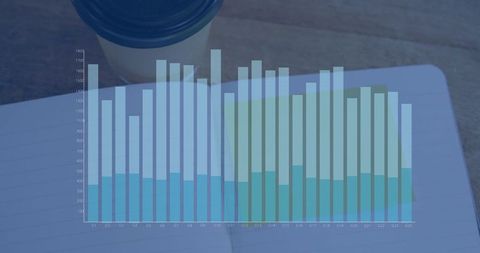
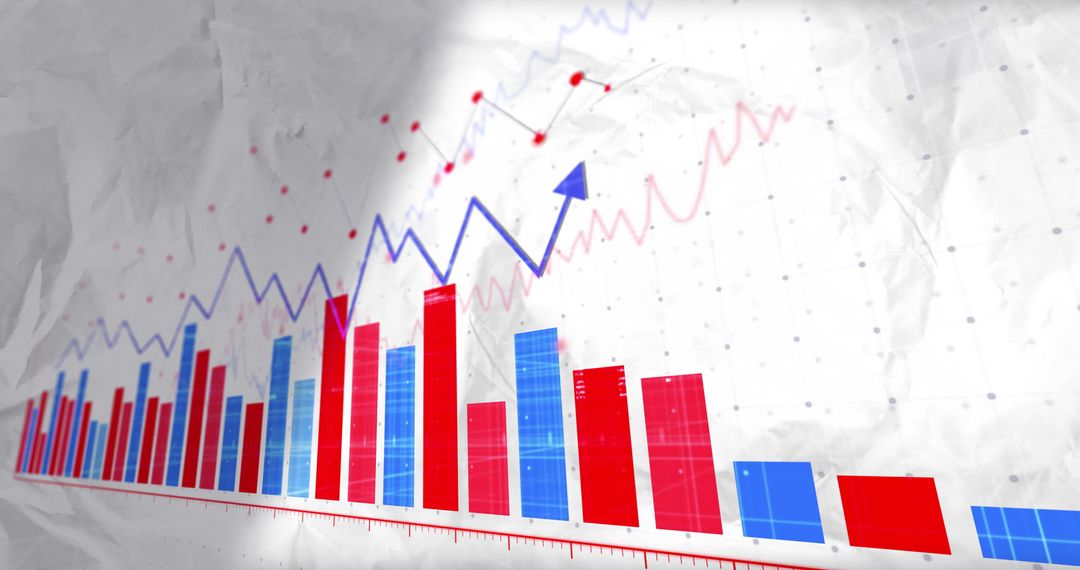
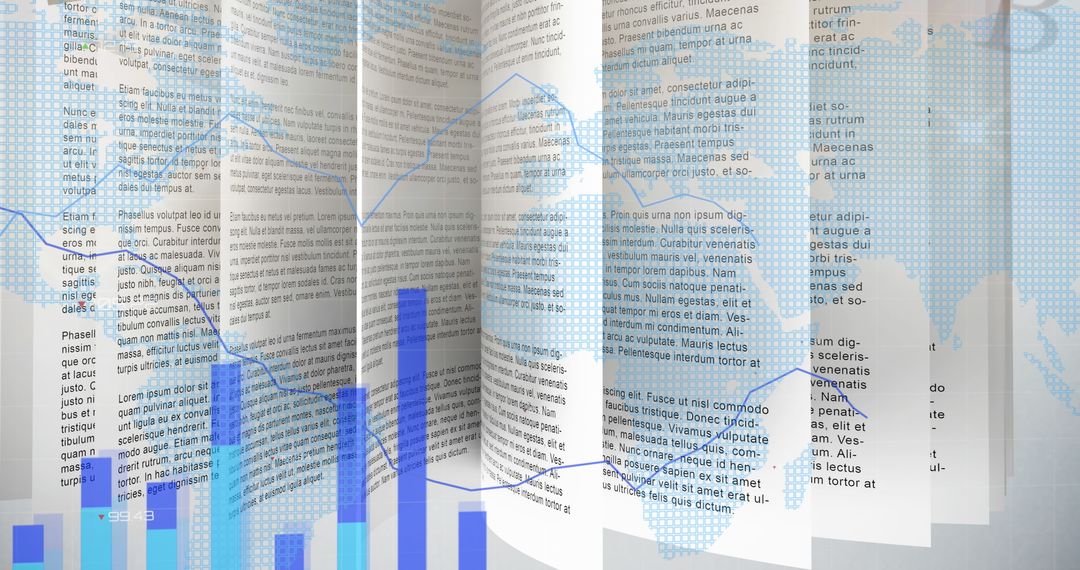
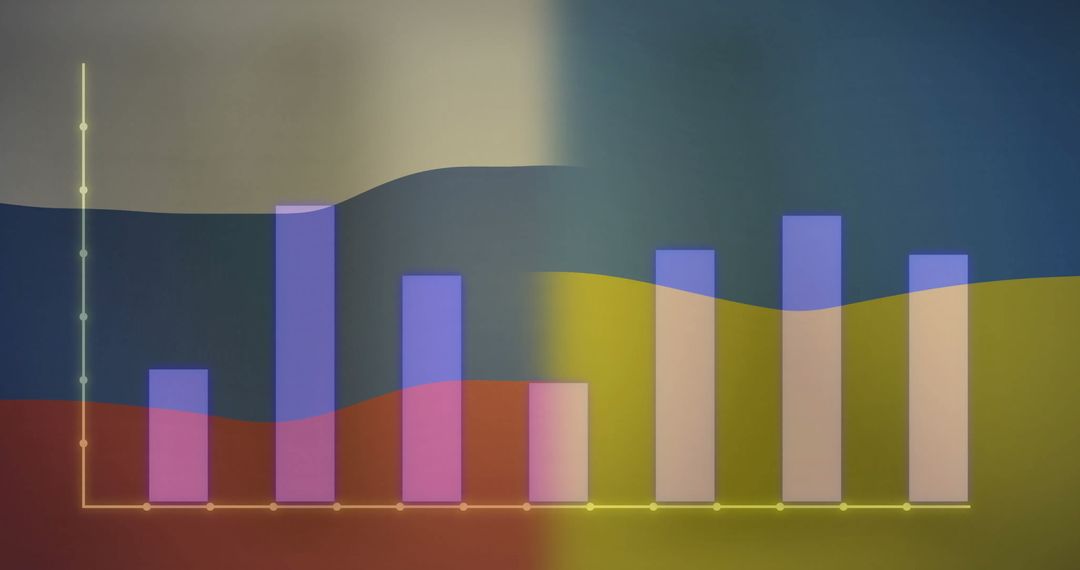
Financial chart with a notebook and coffee cup perfectly captures the essence of modern business environments. Ideal for showcasing themes of data analysis and finance reporting. Use for presentations on investment strategies, or background for articles on stock market trends or business productivity.
Powered by 


2
downloads
downloads
Tags:
More
Credit Photo
If you would like to credit the Photo, here are some ways you can do so
Text Link
photo Link
<span class="text-link">
<span>
<a target="_blank" href=https://pikwizard.com/photo/financial-chart-overlay-with-notebook-and-coffee/5f399bcf09c1d8c7f38070b73309eb7a/>PikWizard</a>
</span>
</span>
<span class="image-link">
<span
style="margin: 0 0 20px 0; display: inline-block; vertical-align: middle; width: 100%;"
>
<a
target="_blank"
href="https://pikwizard.com/photo/financial-chart-overlay-with-notebook-and-coffee/5f399bcf09c1d8c7f38070b73309eb7a/"
style="text-decoration: none; font-size: 10px; margin: 0;"
>
<img src="https://pikwizard.com/pw/medium/5f399bcf09c1d8c7f38070b73309eb7a.jpg" style="margin: 0; width: 100%;" alt="" />
<p style="font-size: 12px; margin: 0;">PikWizard</p>
</a>
</span>
</span>
Free (free of charge)
Free for personal and commercial use.
Author: Creative Art
Similar Free Stock Images

Premium


Premium


Premium


Premium


Premium


Premium


Premium


Premium


Premium


Premium


Premium


Premium


Premium


Premium


Premium


Premium


Premium


Premium


Premium


Premium


Premium


Premium


Premium


Premium