
- Home >
- Stock Photos >
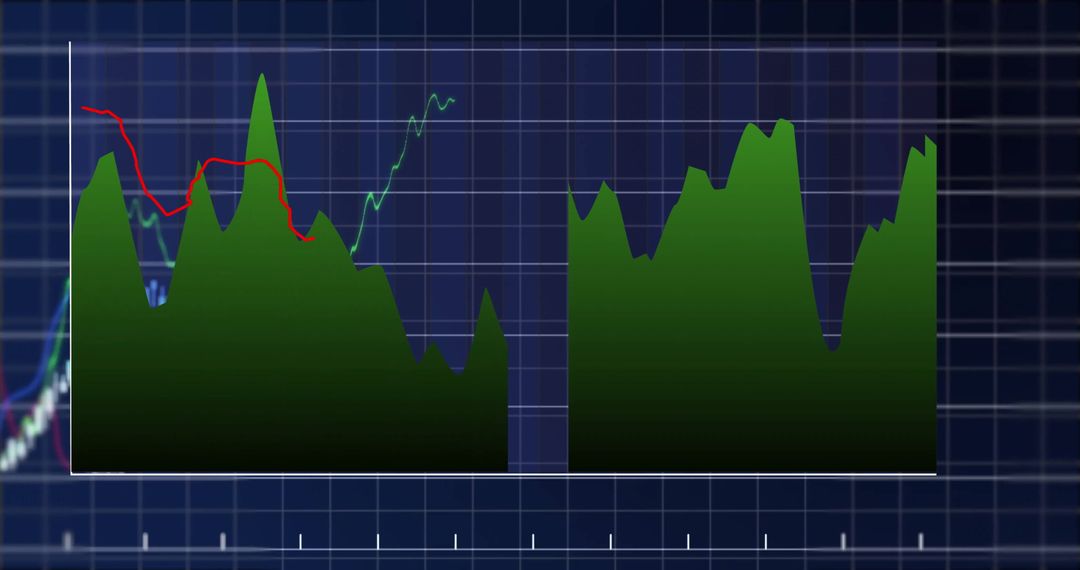
- Financial Chart with Dynamic Data on Black Grid
Financial Chart with Dynamic Data on Black Grid Image

Illustrates complex financial data with a multi-colored line chart on a black grid interface, suggesting flow and analysis of stock prices. Ideal for use in presentations on financial forecasting, statistical analysis, economic trends, or reports on market evaluations. Suited for content highlighting global markets or investment strategies.
Powered by 


2
downloads
downloads
Tags:
More
Credit Photo
If you would like to credit the Photo, here are some ways you can do so
Text Link
photo Link
<span class="text-link">
<span>
<a target="_blank" href=https://pikwizard.com/photo/financial-chart-with-dynamic-data-on-black-grid/371d56395c5dd546afa9638c4b1a715b/>PikWizard</a>
</span>
</span>
<span class="image-link">
<span
style="margin: 0 0 20px 0; display: inline-block; vertical-align: middle; width: 100%;"
>
<a
target="_blank"
href="https://pikwizard.com/photo/financial-chart-with-dynamic-data-on-black-grid/371d56395c5dd546afa9638c4b1a715b/"
style="text-decoration: none; font-size: 10px; margin: 0;"
>
<img src="https://pikwizard.com/pw/medium/371d56395c5dd546afa9638c4b1a715b.jpg" style="margin: 0; width: 100%;" alt="" />
<p style="font-size: 12px; margin: 0;">PikWizard</p>
</a>
</span>
</span>
Free (free of charge)
Free for personal and commercial use.
Author: Creative Art
Similar Free Stock Images

Premium


Premium


Premium


Premium


Premium


Premium


Premium


Premium


Premium


Premium


Premium


Premium


Premium


Premium


Premium


Premium


Premium


Premium


Premium


Premium


Premium


Premium


Premium


Premium

