- Home >
- Stock Photos >
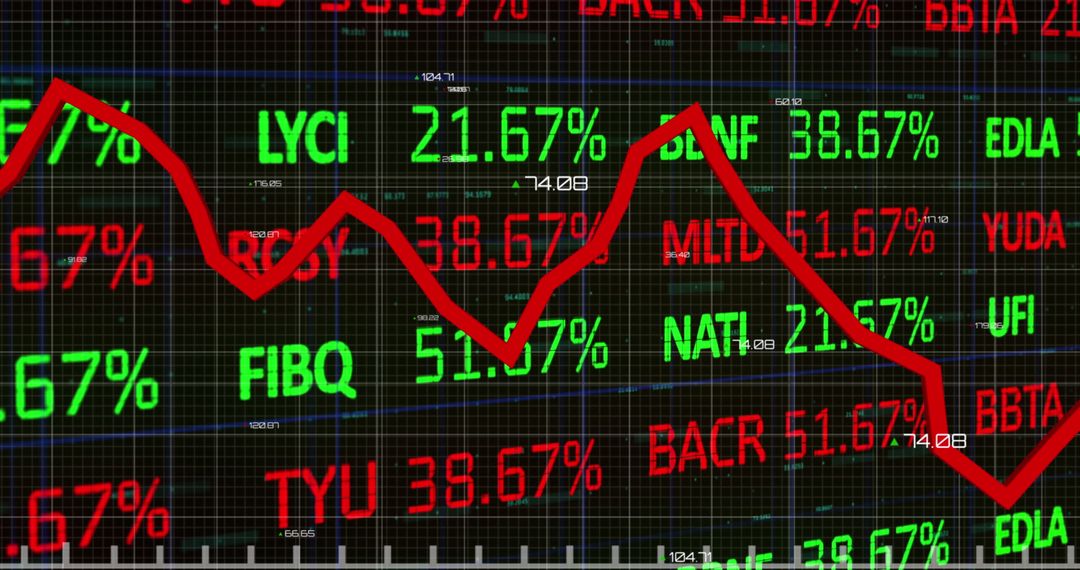
- Financial Chart with Dynamic Numbers on Grid Background
Financial Chart with Dynamic Numbers on Grid Background Image

Futuristic depiction of financial trends ideal for presentations, reports, and business projections. Can be used to illustrate economic data analysis, stock fluctuations, or emerging market dynamics in technology or business environments.
Powered by  - Get 15% off with code: PIKWIZARD15


2
downloads
downloads
Tags:
More
Credit Photo
If you would like to credit the Photo, here are some ways you can do so
Text Link
photo Link
<span class="text-link">
<span>
<a target="_blank" href=https://pikwizard.com/photo/financial-chart-with-dynamic-numbers-on-grid-background/704a9a5f2ef07554759ff7274f65be69/>PikWizard</a>
</span>
</span>
<span class="image-link">
<span
style="margin: 0 0 20px 0; display: inline-block; vertical-align: middle; width: 100%;"
>
<a
target="_blank"
href="https://pikwizard.com/photo/financial-chart-with-dynamic-numbers-on-grid-background/704a9a5f2ef07554759ff7274f65be69/"
style="text-decoration: none; font-size: 10px; margin: 0;"
>
<img src="https://pikwizard.com/pw/medium/704a9a5f2ef07554759ff7274f65be69.jpg" style="margin: 0; width: 100%;" alt="" />
<p style="font-size: 12px; margin: 0;">PikWizard</p>
</a>
</span>
</span>
Free (free of charge)
Free for personal and commercial use.
Author: Authentic Images
Similar Free Stock Images