- Home >
- Stock Photos >
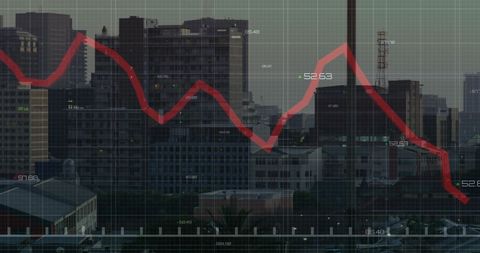
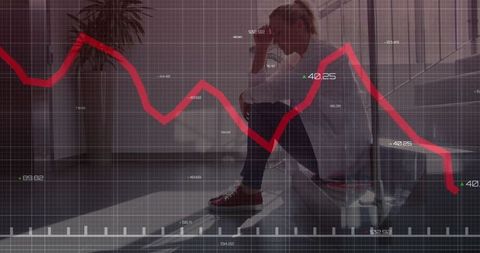
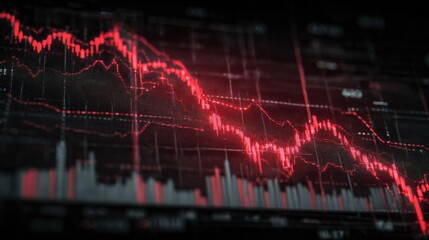
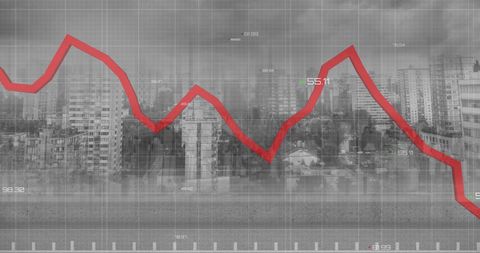
- Financial Chart with Falling Trends in Corporate Environment
Financial Chart with Falling Trends in Corporate Environment Image

Digitally generated image showing a downward trending red graph against a backdrop of an empty, modern office. Useful for illustrating economic challenges, market analysis reports, financial news articles, and presentations about business strategies. It emphasizes the impact of economic decline on corporate settings and investment perceptions.
Powered by 


2
downloads
downloads
Tags:
More
Credit Photo
If you would like to credit the Photo, here are some ways you can do so
Text Link
photo Link
<span class="text-link">
<span>
<a target="_blank" href=https://pikwizard.com/photo/financial-chart-with-falling-trends-in-corporate-environment/9028c2d884553163b8123dcae4e37146/>PikWizard</a>
</span>
</span>
<span class="image-link">
<span
style="margin: 0 0 20px 0; display: inline-block; vertical-align: middle; width: 100%;"
>
<a
target="_blank"
href="https://pikwizard.com/photo/financial-chart-with-falling-trends-in-corporate-environment/9028c2d884553163b8123dcae4e37146/"
style="text-decoration: none; font-size: 10px; margin: 0;"
>
<img src="https://pikwizard.com/pw/medium/9028c2d884553163b8123dcae4e37146.jpg" style="margin: 0; width: 100%;" alt="" />
<p style="font-size: 12px; margin: 0;">PikWizard</p>
</a>
</span>
</span>
Free (free of charge)
Free for personal and commercial use.
Author: Awesome Content
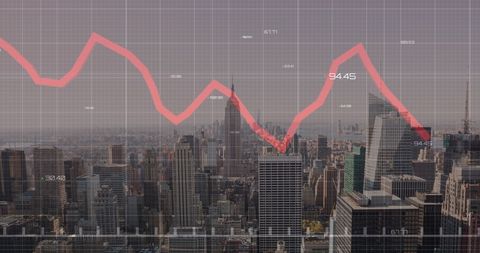
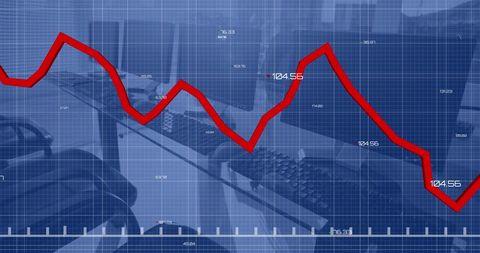
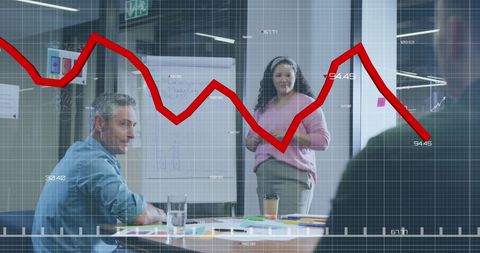
Similar Free Stock Images
Loading...

Premium


Premium

Premium


Premium


Premium


Premium

Premium

Premium


Premium


Premium


Premium


Premium


Premium


Premium

Premium

Premium


Premium


Premium


Premium


Premium

Premium

Premium


Premium


Premium


Premium