
- Home >
- Stock Photos >
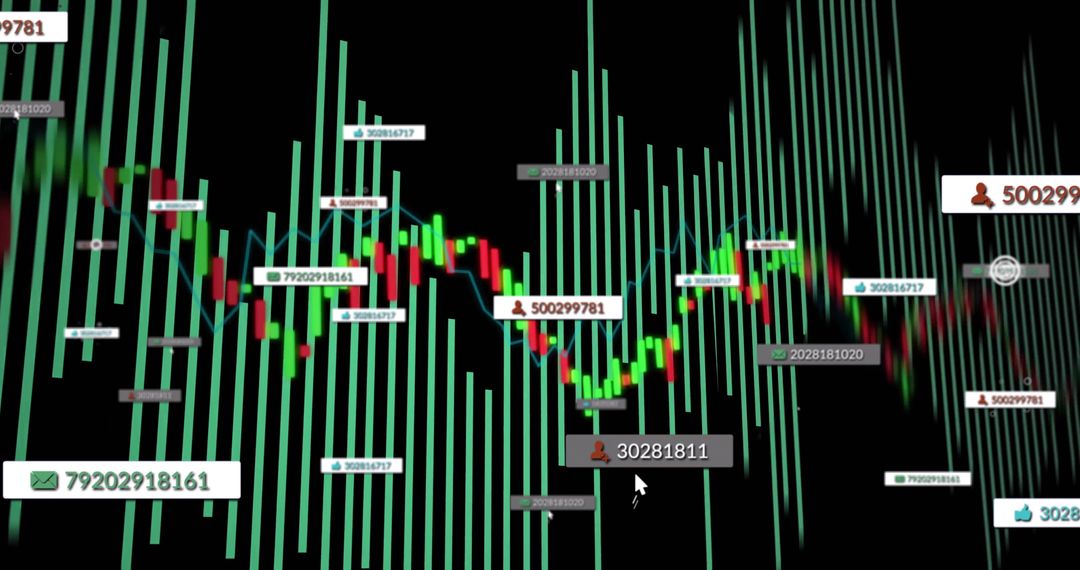
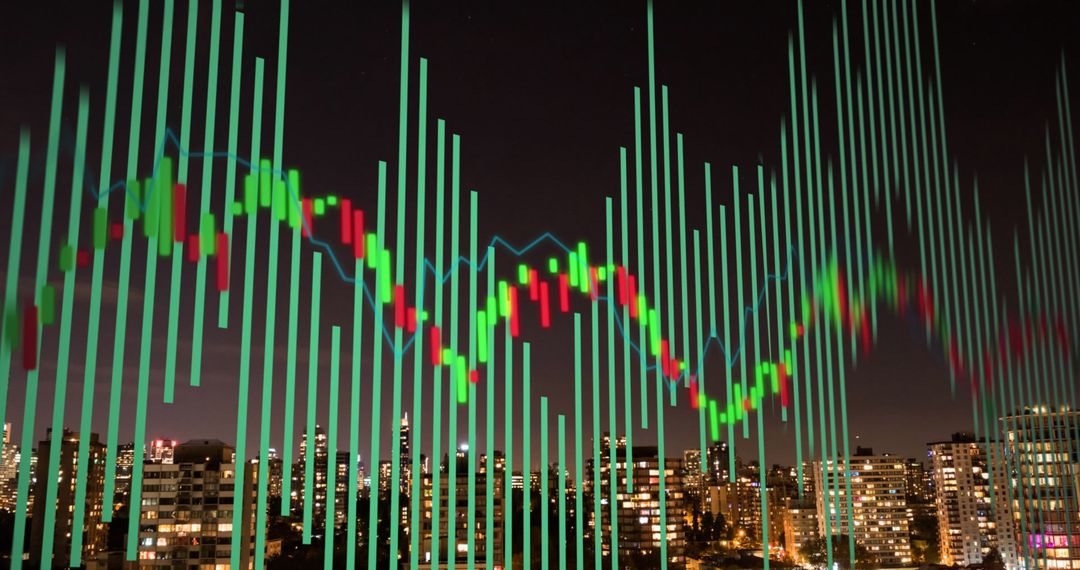
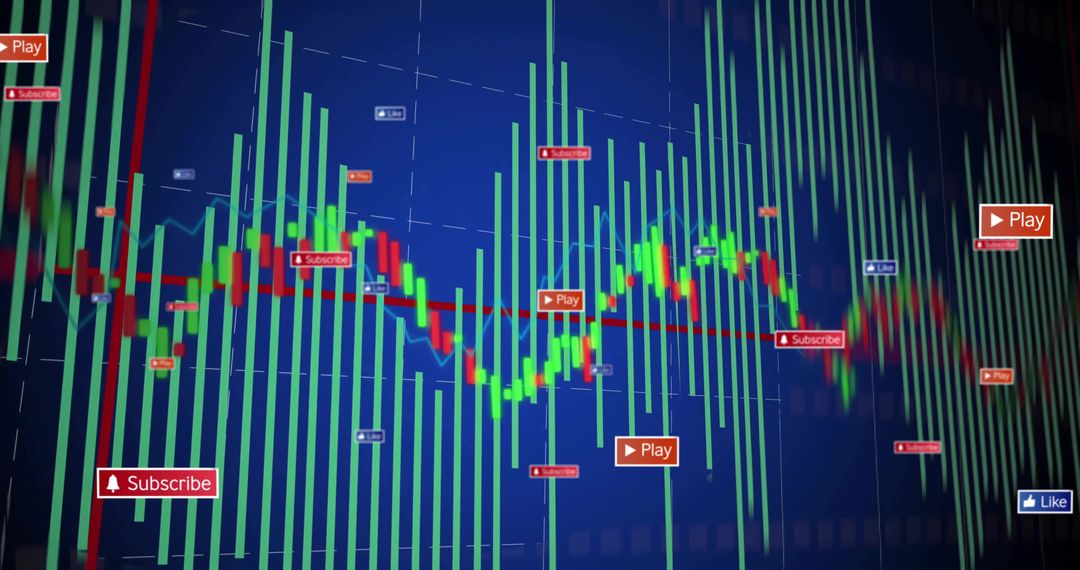
- Financial Chart with Social Media Notifications Interface
Financial Chart with Social Media Notifications Interface Image

This visualization depicts financial data represented with bar graphs and candlesticks, overlayed with social media-style notifications such as Likes and Friend Added. It illustrates the intersection of financial analysis and social platforms, making it ideal for presentations or marketing materials targeting investors looking for collaborative and technology-driven trading solutions. The blending of elements could also be attention-getting for digital finance apps or analytic dashboard proposals.
Powered by 


2
downloads
downloads
Tags:
More
Credit Photo
If you would like to credit the Photo, here are some ways you can do so
Text Link
photo Link
<span class="text-link">
<span>
<a target="_blank" href=https://pikwizard.com/photo/financial-chart-with-social-media-notifications-interface/18a8f557a83668774ba78f87201164c4/>PikWizard</a>
</span>
</span>
<span class="image-link">
<span
style="margin: 0 0 20px 0; display: inline-block; vertical-align: middle; width: 100%;"
>
<a
target="_blank"
href="https://pikwizard.com/photo/financial-chart-with-social-media-notifications-interface/18a8f557a83668774ba78f87201164c4/"
style="text-decoration: none; font-size: 10px; margin: 0;"
>
<img src="https://pikwizard.com/pw/medium/18a8f557a83668774ba78f87201164c4.jpg" style="margin: 0; width: 100%;" alt="" />
<p style="font-size: 12px; margin: 0;">PikWizard</p>
</a>
</span>
</span>
Free (free of charge)
Free for personal and commercial use.
Author: People Creations
Similar Free Stock Images

Premium


Premium


Premium


Premium


Premium


Premium


Premium


Premium


Premium


Premium


Premium


Premium


Premium


Premium


Premium


Premium


Premium


Premium


Premium


Premium


Premium


Premium


Premium


Premium

