- Home >
- Stock Photos >
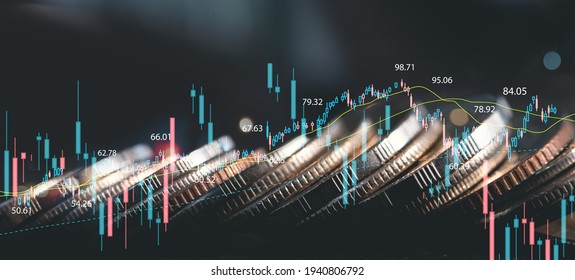
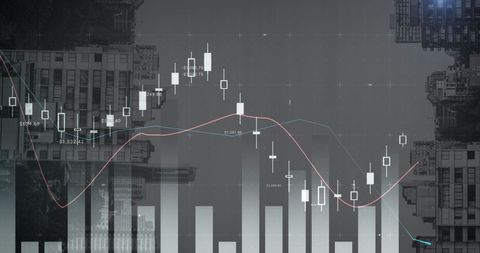
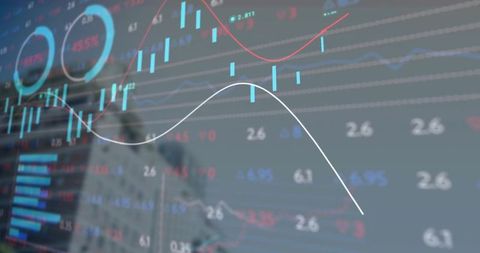
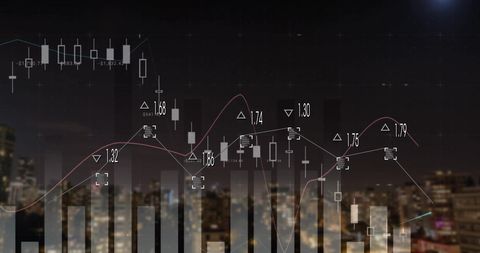
- Financial Chart with Trend Line and Iconic Background
Financial Chart with Trend Line and Iconic Background Image

Row of white candlesticks on dark grid with red trend line illustrates financial data fluctuations. Background adorned with faint finance and technology icons, enhancing data-driven atmosphere. Ideal for presentations, analyses, and reports on stock market trends, investment strategies, and financial growth.
Powered by  - Get 15% off with code: PIKWIZARD15


0
downloads
downloads
Tags:
More
Credit Photo
If you would like to credit the Photo, here are some ways you can do so
Text Link
photo Link
<span class="text-link">
<span>
<a target="_blank" href=https://pikwizard.com/photo/financial-chart-with-trend-line-and-iconic-background/9fb760684b67c75a3e597e9a85365ebe/>PikWizard</a>
</span>
</span>
<span class="image-link">
<span
style="margin: 0 0 20px 0; display: inline-block; vertical-align: middle; width: 100%;"
>
<a
target="_blank"
href="https://pikwizard.com/photo/financial-chart-with-trend-line-and-iconic-background/9fb760684b67c75a3e597e9a85365ebe/"
style="text-decoration: none; font-size: 10px; margin: 0;"
>
<img src="https://pikwizard.com/pw/medium/9fb760684b67c75a3e597e9a85365ebe.jpg" style="margin: 0; width: 100%;" alt="" />
<p style="font-size: 12px; margin: 0;">PikWizard</p>
</a>
</span>
</span>
Free (free of charge)
Free for personal and commercial use.
Author: Authentic Images
Similar Free Stock Images
Loading...

Premium


Premium


Premium


Premium


Premium


Premium


Premium

Premium


Premium


Premium


Premium


Premium


Premium


Premium


Premium

Premium


Premium

Premium


Premium


Premium


Premium


Premium


Premium


Premium


Premium