- Home >
- Stock Photos >
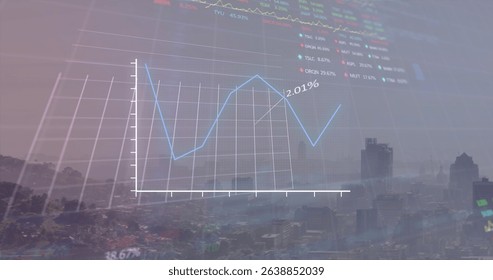
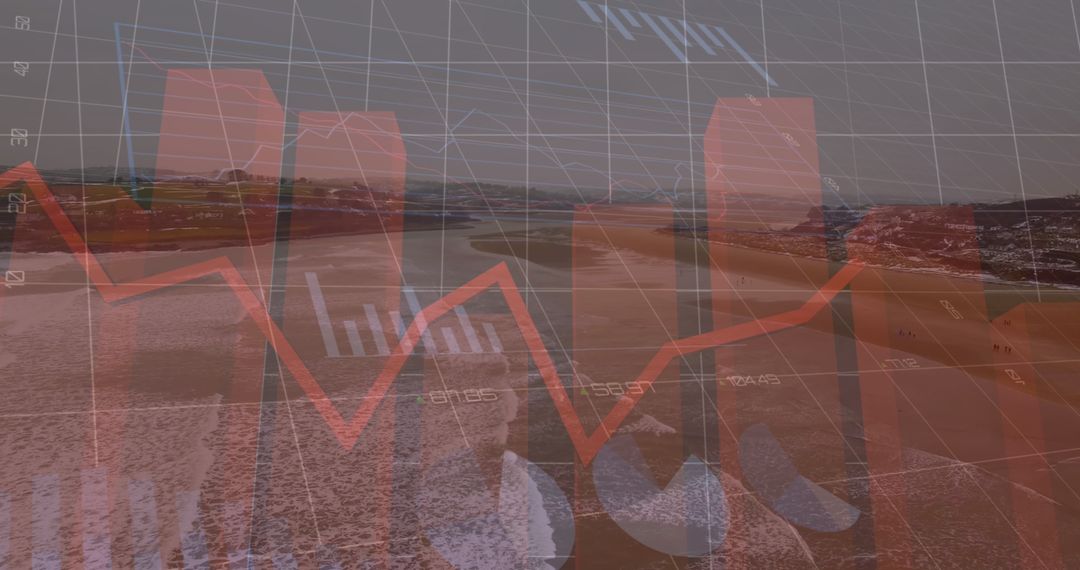
- Financial Charts Overlapping Urban Skyline with Digital Interface
Financial Charts Overlapping Urban Skyline with Digital Interface Image

Visual combines elements of financial charts superimposed on cityscape imagery, suggesting a blend of data analysis with urban development. Suitable for use in contexts relating to financial forecasting, economic trends, urbanization studies, and technology-driven analysis in global markets.
Powered by  - Get 15% off with code: PIKWIZARD15


2
downloads
downloads
Tags:
More
Credit Photo
If you would like to credit the Photo, here are some ways you can do so
Text Link
photo Link
<span class="text-link">
<span>
<a target="_blank" href=https://pikwizard.com/photo/financial-charts-overlapping-urban-skyline-with-digital-interface/41df8cf6e654ffce4977c3e4974d83ac/>PikWizard</a>
</span>
</span>
<span class="image-link">
<span
style="margin: 0 0 20px 0; display: inline-block; vertical-align: middle; width: 100%;"
>
<a
target="_blank"
href="https://pikwizard.com/photo/financial-charts-overlapping-urban-skyline-with-digital-interface/41df8cf6e654ffce4977c3e4974d83ac/"
style="text-decoration: none; font-size: 10px; margin: 0;"
>
<img src="https://pikwizard.com/pw/medium/41df8cf6e654ffce4977c3e4974d83ac.jpg" style="margin: 0; width: 100%;" alt="" />
<p style="font-size: 12px; margin: 0;">PikWizard</p>
</a>
</span>
</span>
Free (free of charge)
Free for personal and commercial use.
Author: Awesome Content
Similar Free Stock Images

Premium


Premium


Premium


Premium


Premium


Premium


Premium


Premium


Premium


Premium


Premium


Premium


Premium


Premium


Premium


Premium


Premium


Premium


Premium


Premium


Premium


Premium


Premium


Premium