- Home >
- Stock Photos >
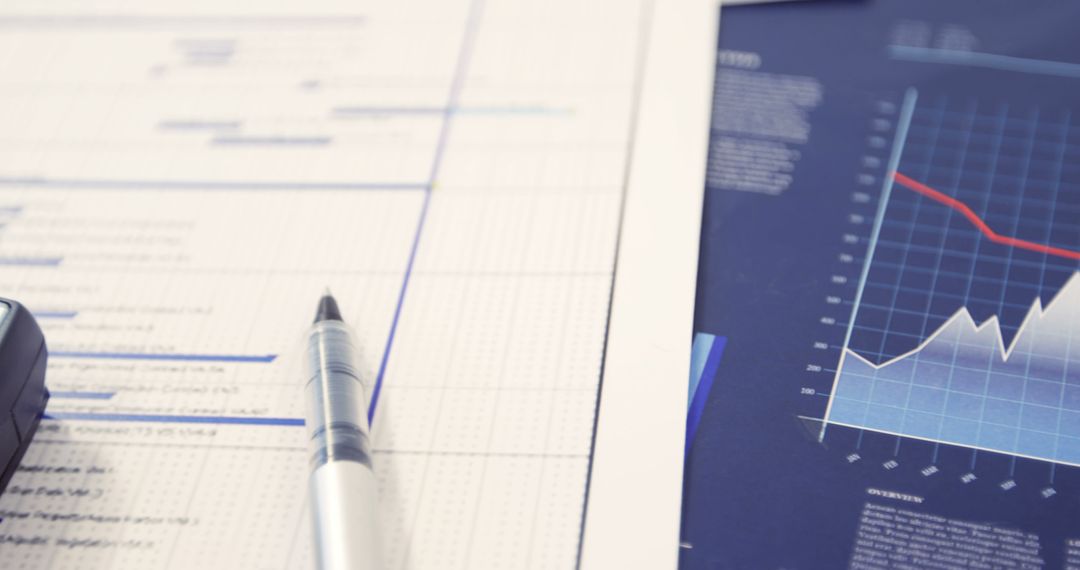
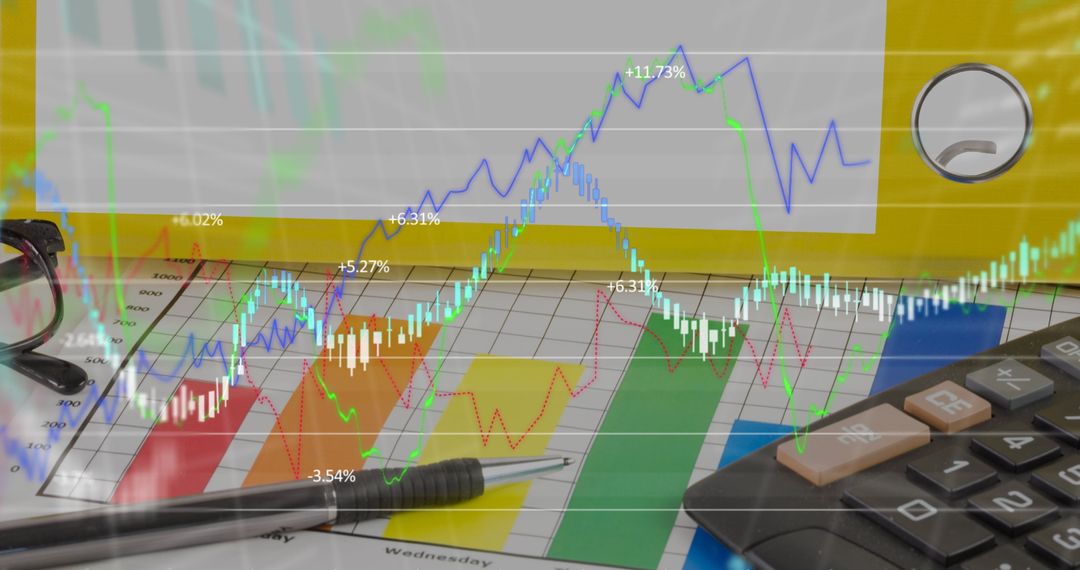
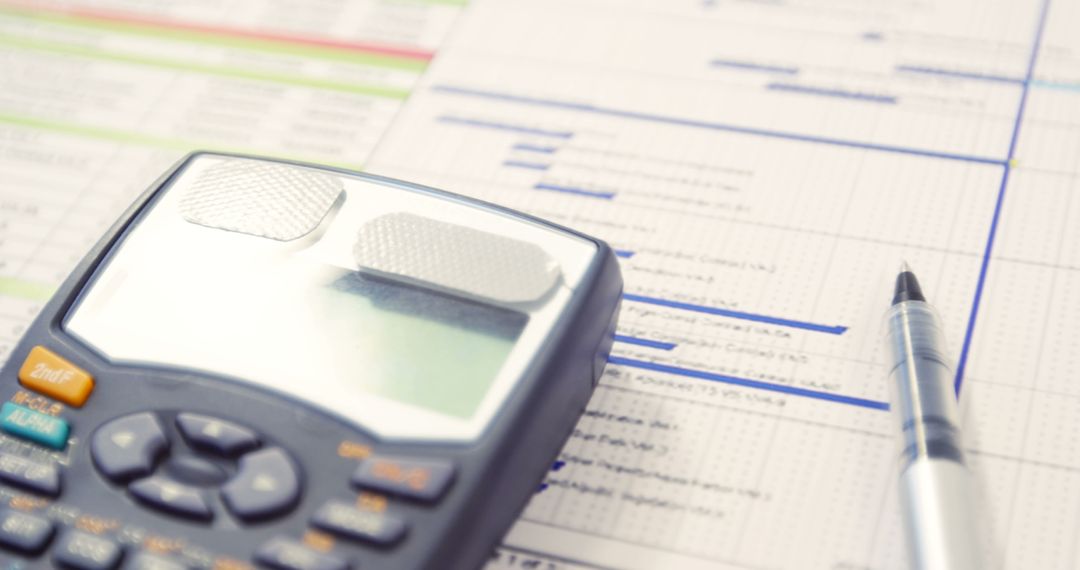
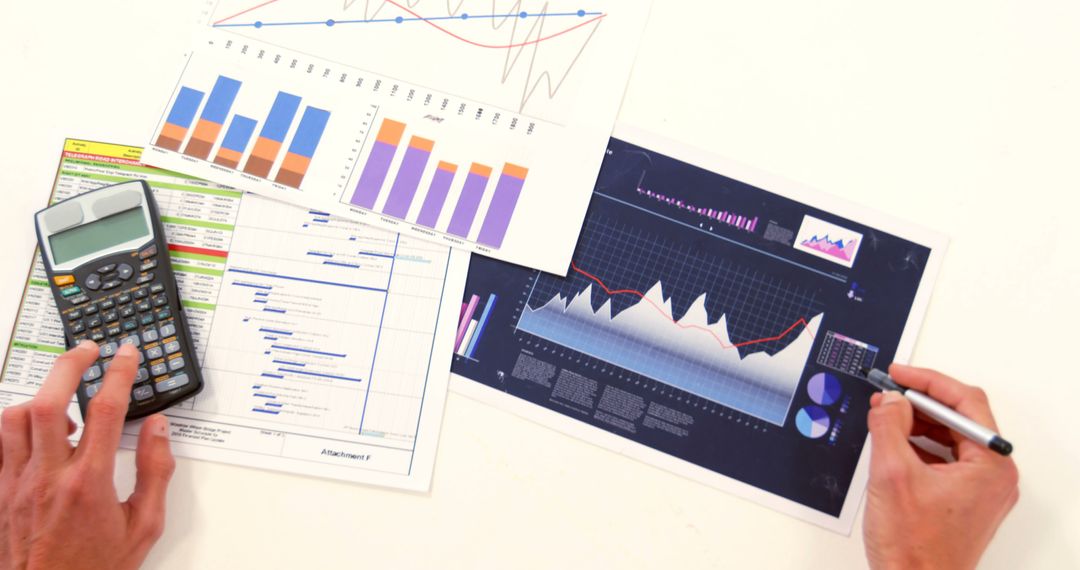
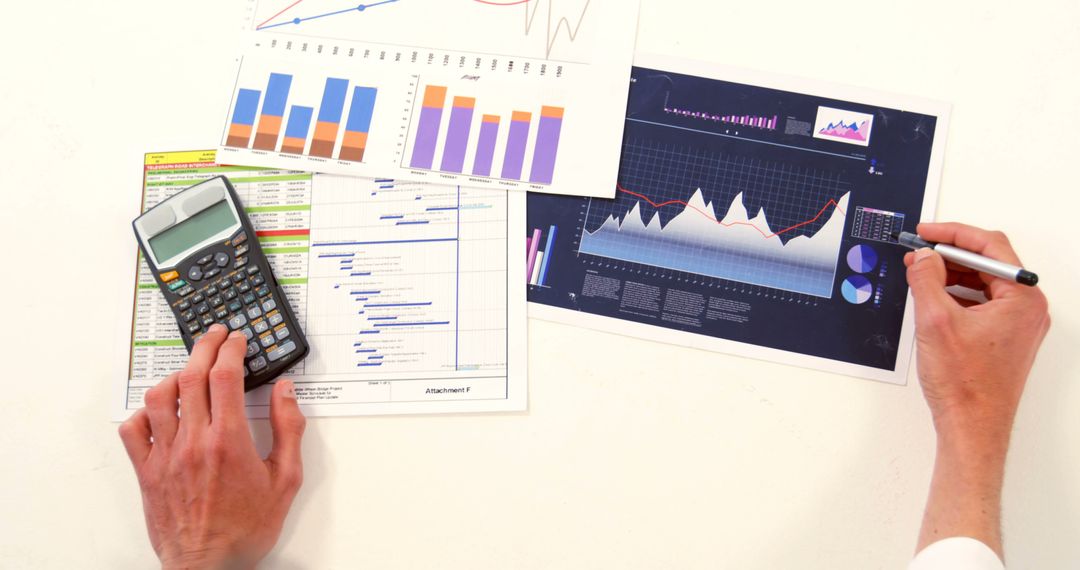
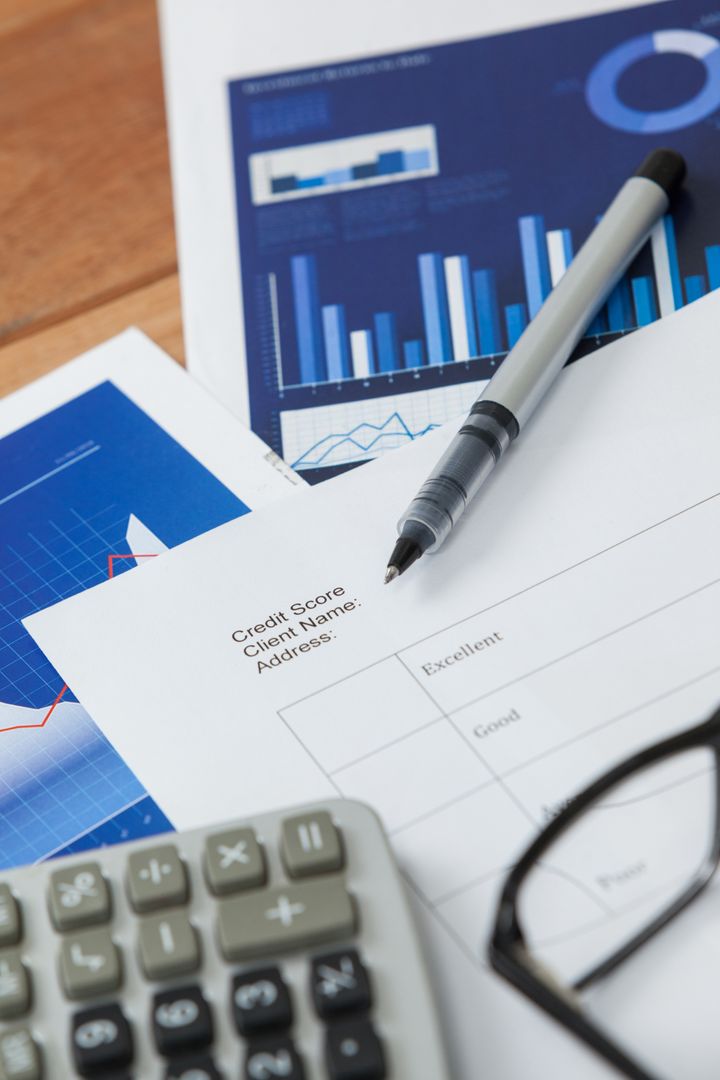
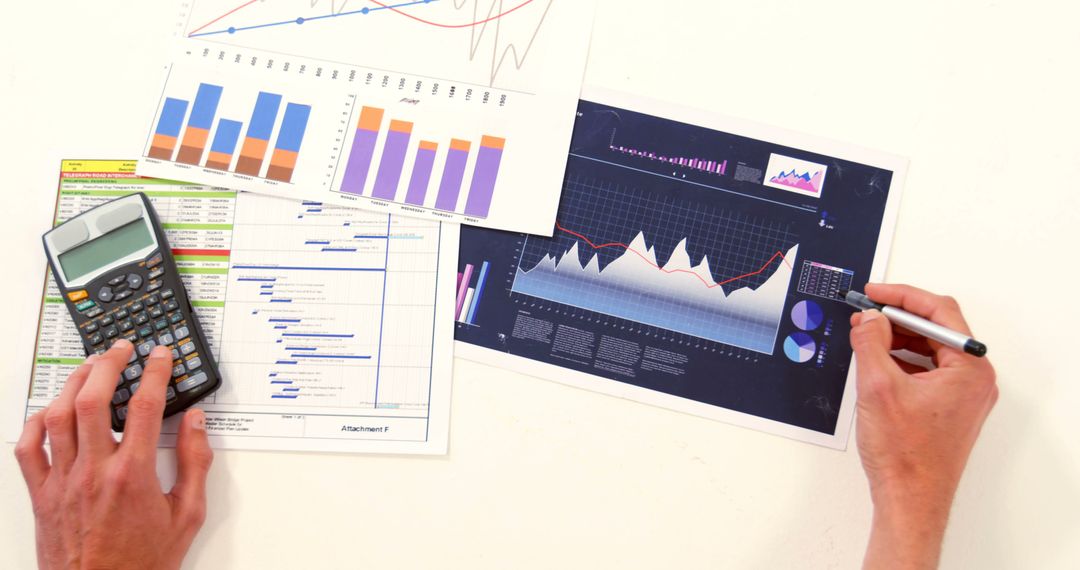
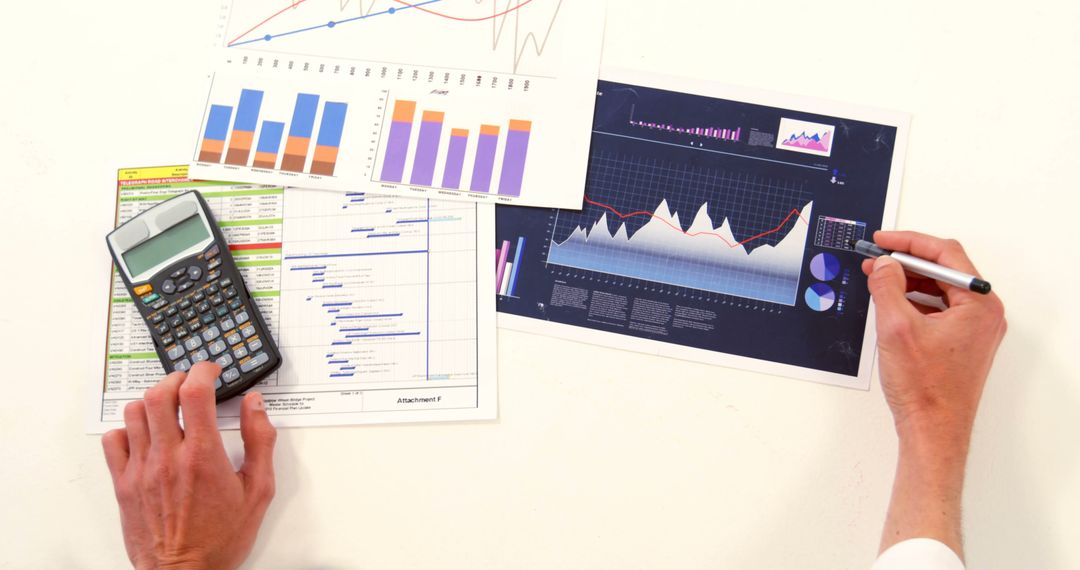
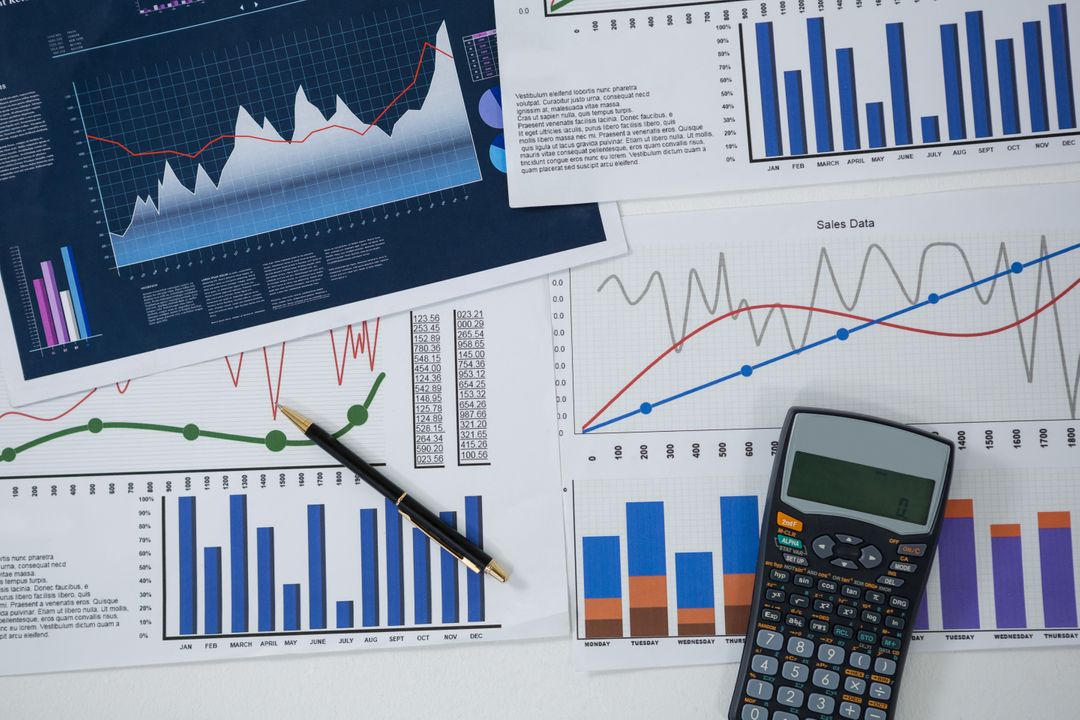
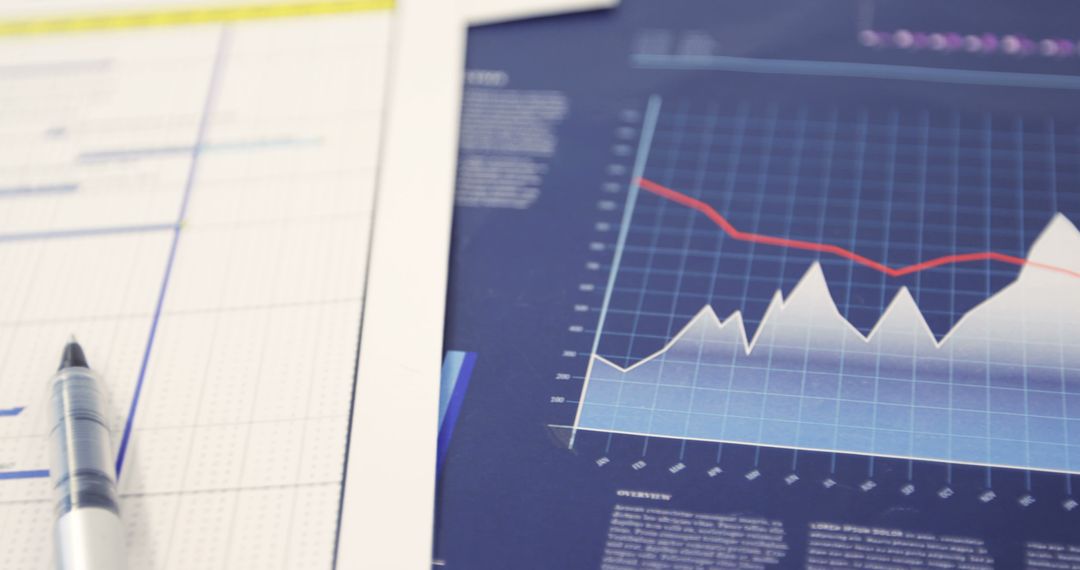
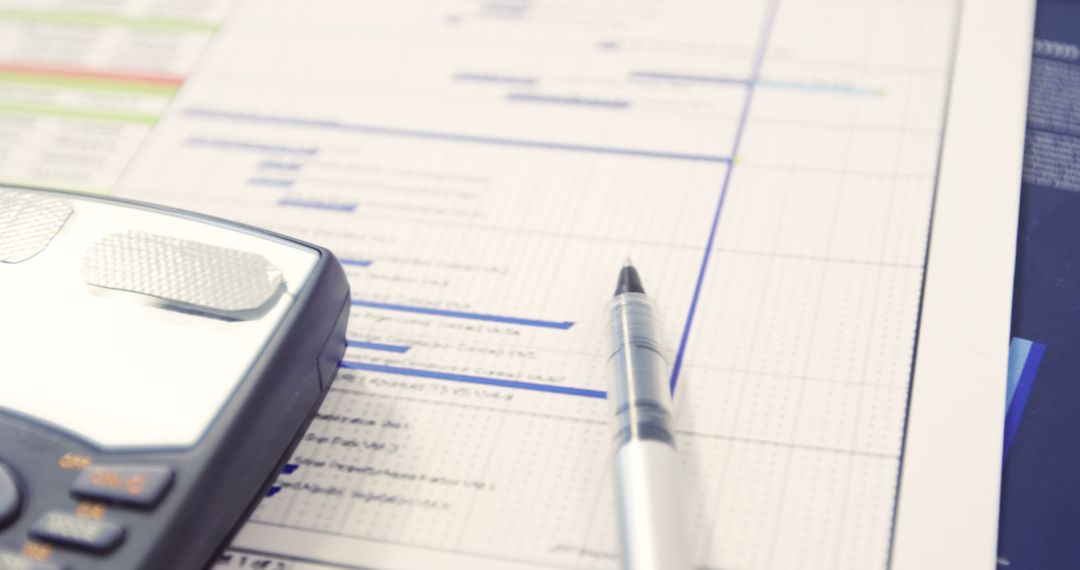
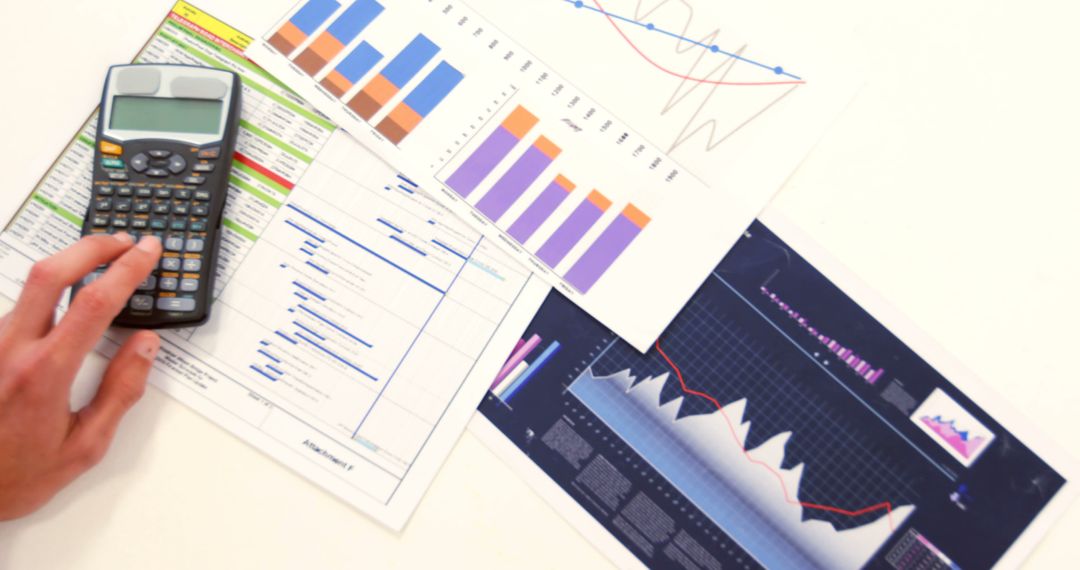
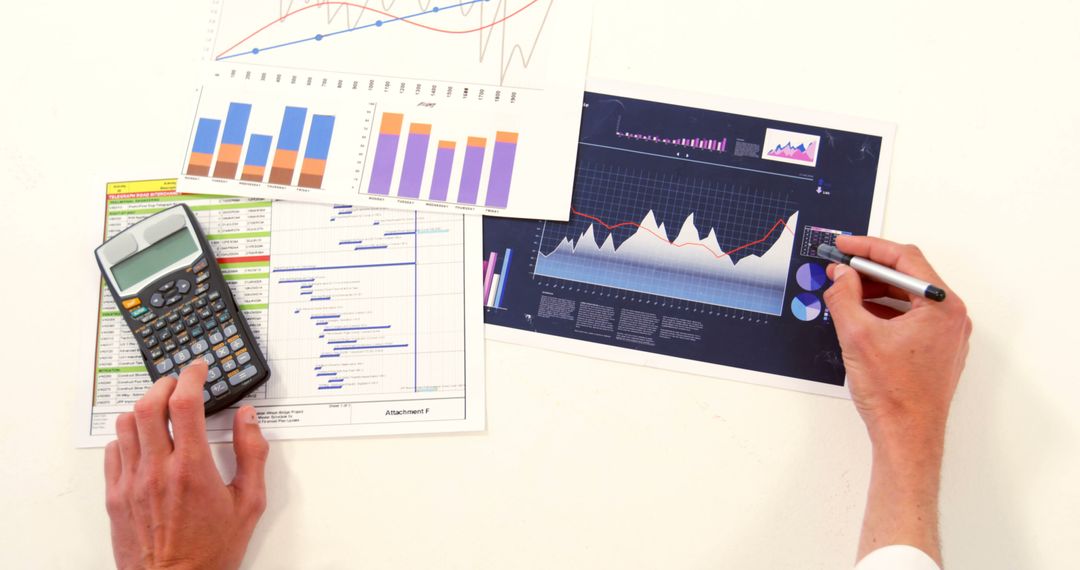
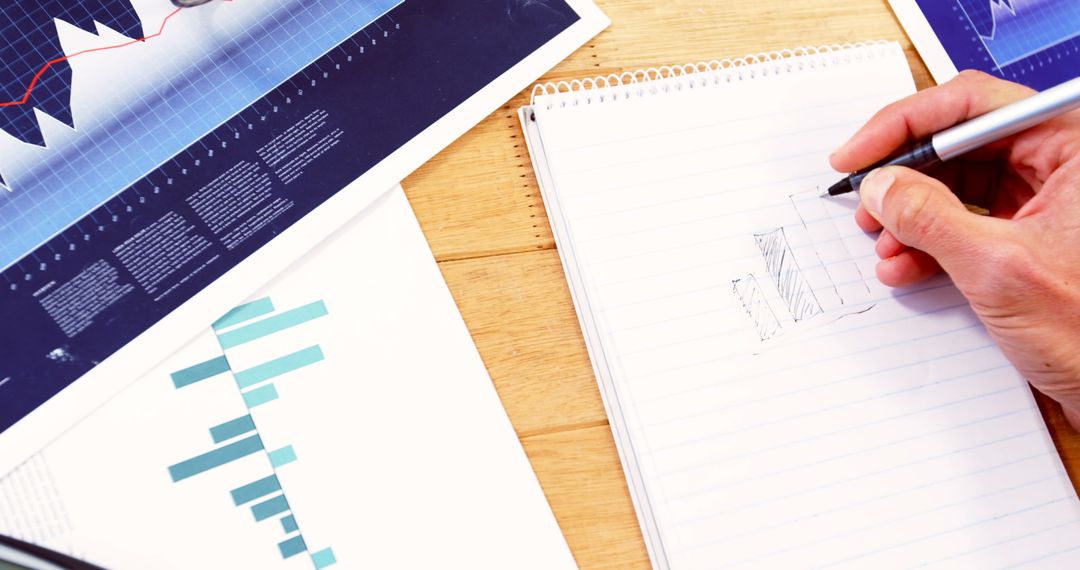
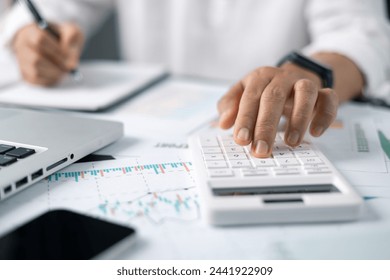
- Financial Charts, Reports and Calculator on Desk
Financial Charts, Reports and Calculator on Desk Image
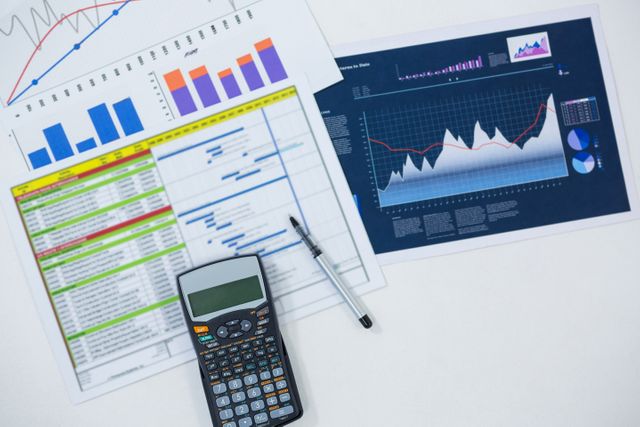
Display of financial documents including charts and graphs next to a calculator and pen suggests active data analysis. Useful for illustrating topics related to finance, economic planning, business analysis, financial reports, or strategy meetings. Ideal for articles on budgeting, accounting or corporate presentations dealing with financial statistics or trends.
Powered by  - Get 15% off with code: PIKWIZARD15


35
downloads
downloads
Tags:
More
Credit Photo
If you would like to credit the Photo, here are some ways you can do so
Text Link
photo Link
<span class="text-link">
<span>
<a target="_blank" href=https://pikwizard.com/photo/financial-charts-reports-and-calculator-on-desk/cf8ce3c7b3b9f043d56638f1c0eb6d3c/>PikWizard</a>
</span>
</span>
<span class="image-link">
<span
style="margin: 0 0 20px 0; display: inline-block; vertical-align: middle; width: 100%;"
>
<a
target="_blank"
href="https://pikwizard.com/photo/financial-charts-reports-and-calculator-on-desk/cf8ce3c7b3b9f043d56638f1c0eb6d3c/"
style="text-decoration: none; font-size: 10px; margin: 0;"
>
<img src="https://pikwizard.com/pw/medium/cf8ce3c7b3b9f043d56638f1c0eb6d3c.jpg" style="margin: 0; width: 100%;" alt="" />
<p style="font-size: 12px; margin: 0;">PikWizard</p>
</a>
</span>
</span>
Free (free of charge)
Free for personal and commercial use.
Author: Authentic Images
Similar Free Stock Images
Premium


Premium
Premium


Premium


Premium


Premium


Premium


Premium


Premium


Premium


Premium


Premium


Premium


Premium


Premium


Premium


Premium


Premium


Premium

Premium


Premium


Premium


Premium


Premium