- Home >
- Stock Photos >
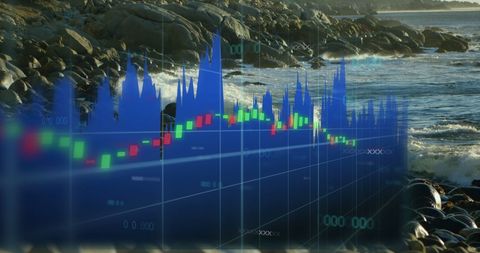
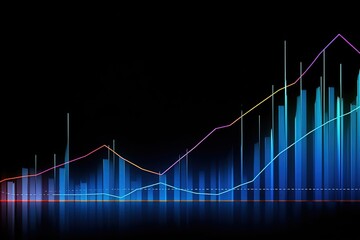
- Financial Charts with Upward Trend and Analysis Tools
Financial Charts with Upward Trend and Analysis Tools Image

Abstract representation of financial data with graphs and an upward arrow indicating positive market trends. Suitable for use in financial reports, presentations on stock market analysis, business growth projections, and global economic outlooks.
Powered by 


downloads
Tags:
More
Credit Photo
If you would like to credit the Photo, here are some ways you can do so
Text Link
photo Link
<span class="text-link">
<span>
<a target="_blank" href=https://pikwizard.com/photo/financial-charts-with-upward-trend-and-analysis-tools/45efe52cd24eebb2c35cd0f53b187979/>PikWizard</a>
</span>
</span>
<span class="image-link">
<span
style="margin: 0 0 20px 0; display: inline-block; vertical-align: middle; width: 100%;"
>
<a
target="_blank"
href="https://pikwizard.com/photo/financial-charts-with-upward-trend-and-analysis-tools/45efe52cd24eebb2c35cd0f53b187979/"
style="text-decoration: none; font-size: 10px; margin: 0;"
>
<img src="https://pikwizard.com/pw/medium/45efe52cd24eebb2c35cd0f53b187979.jpg" style="margin: 0; width: 100%;" alt="" />
<p style="font-size: 12px; margin: 0;">PikWizard</p>
</a>
</span>
</span>
Free (free of charge)
Free for personal and commercial use.
Author: People Creations
Similar Free Stock Images
Loading...

Premium


Premium


Premium


Premium


Premium


Premium

Premium


Premium


Premium


Premium


Premium


Premium


Premium


Premium


Premium


Premium


Premium


Premium


Premium

Premium


Premium


Premium


Premium


Premium


Premium