- Home >
- Stock Photos >
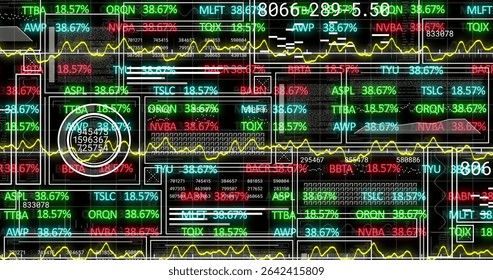
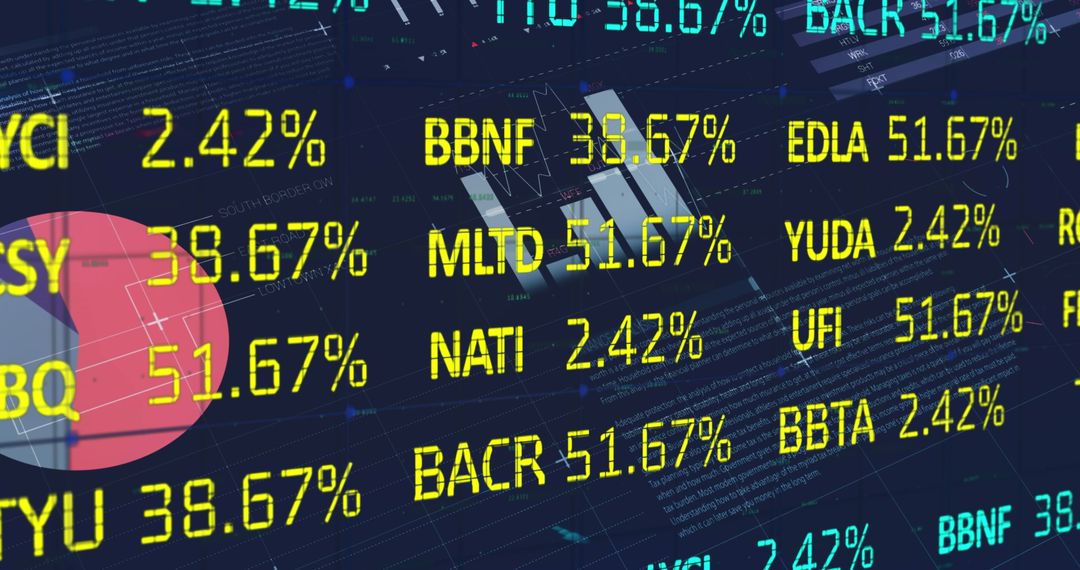
- Financial Dashboard Display with Stock Tickers and Analytics Graphs
Financial Dashboard Display with Stock Tickers and Analytics Graphs Image

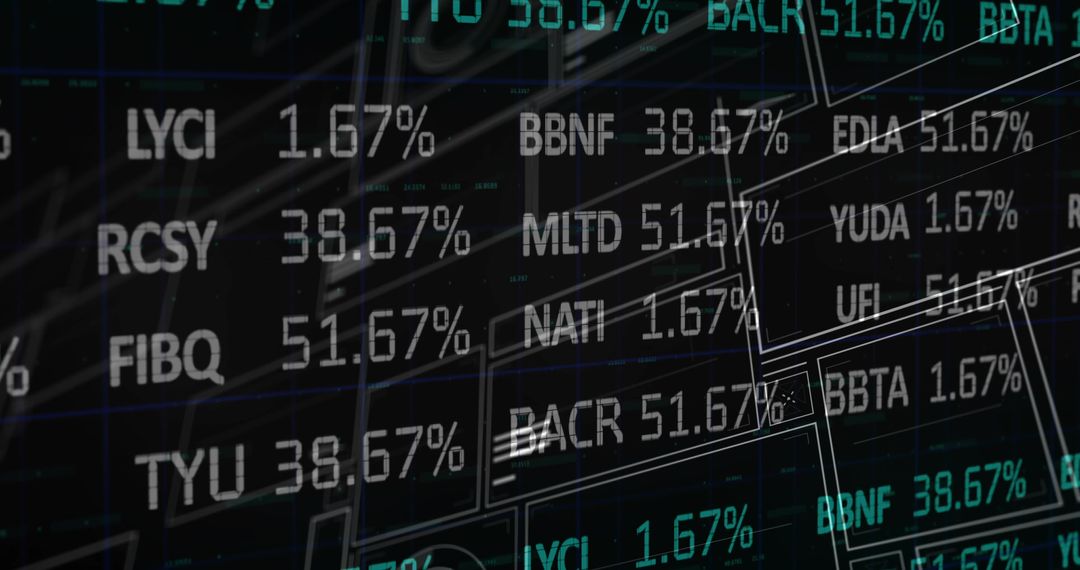
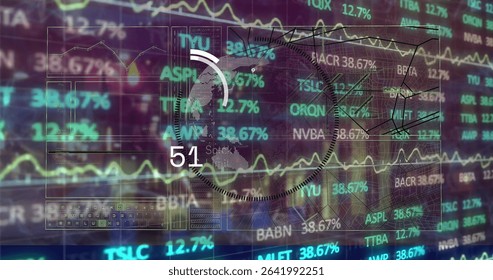
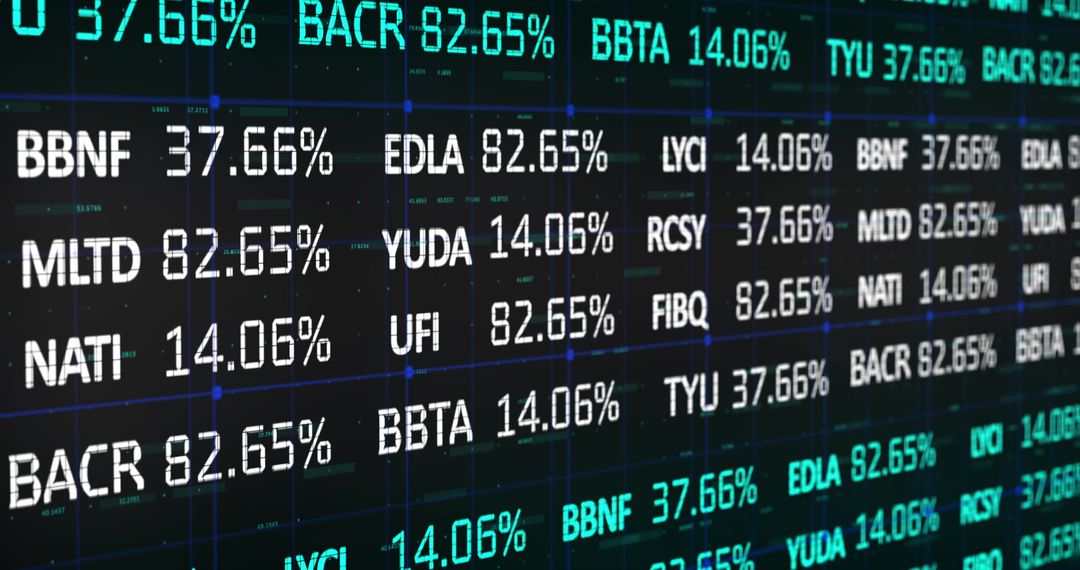
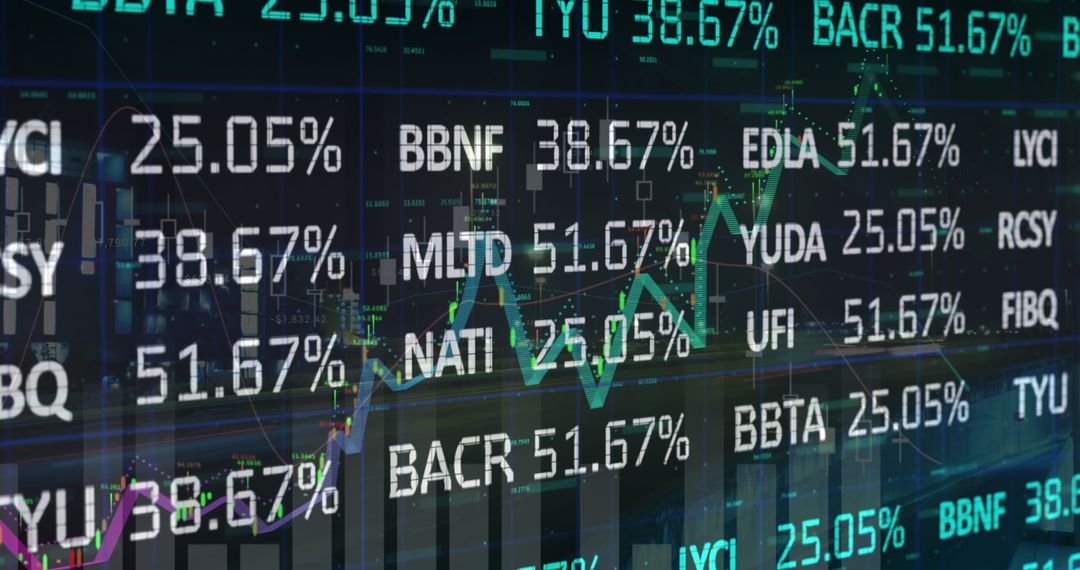
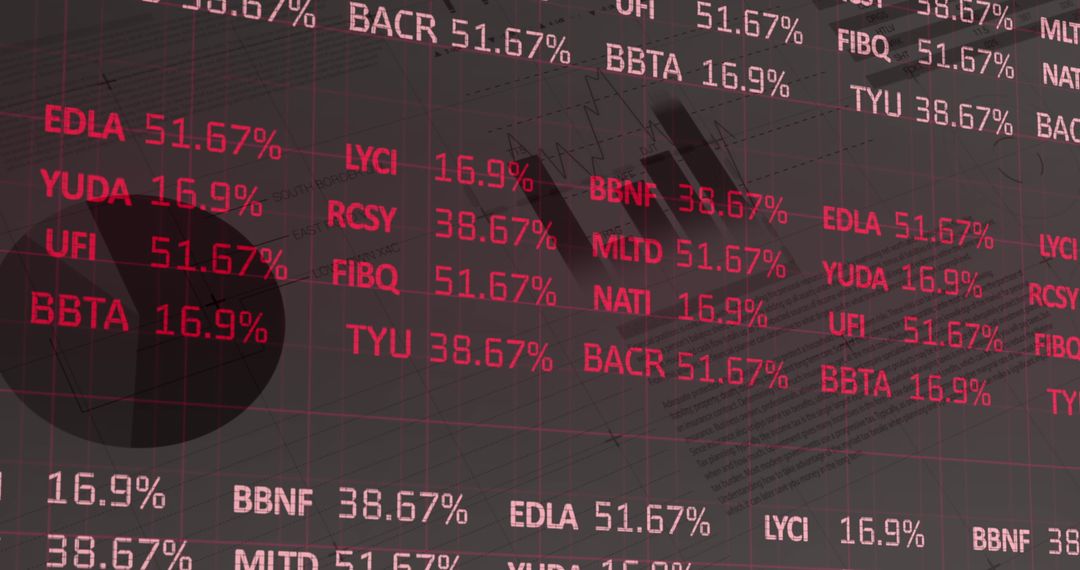
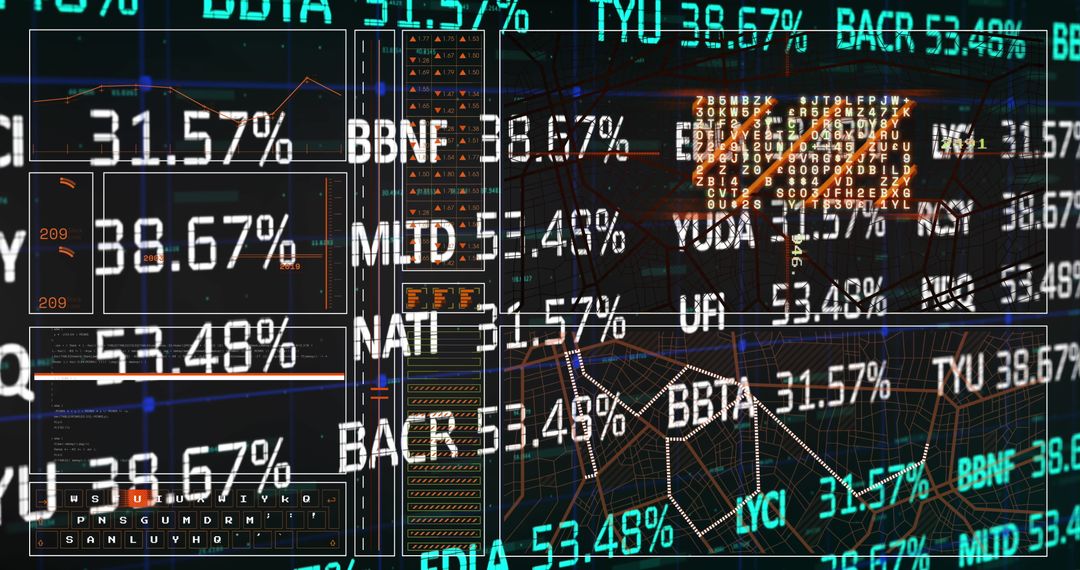
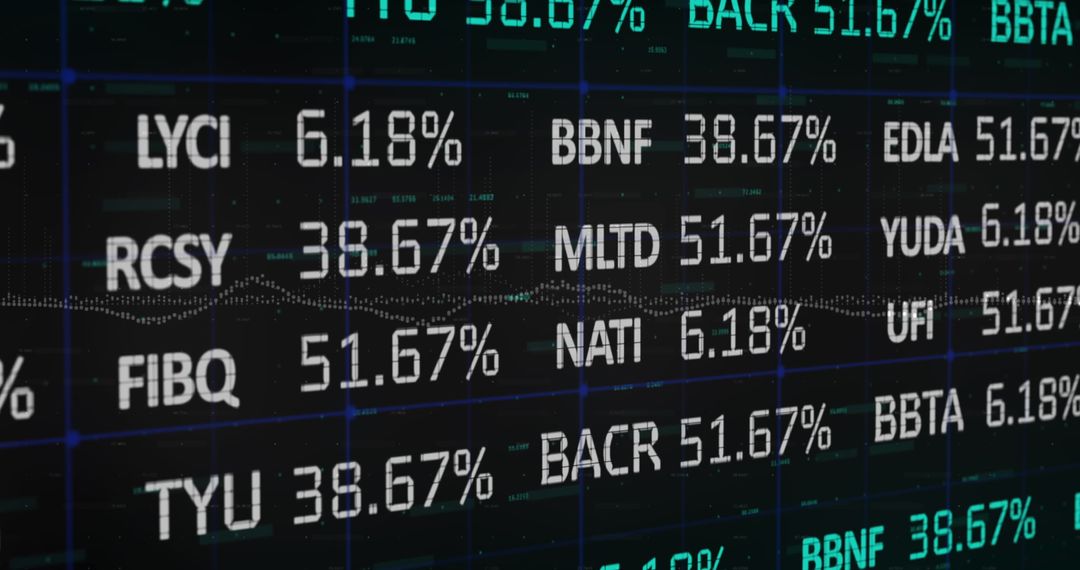
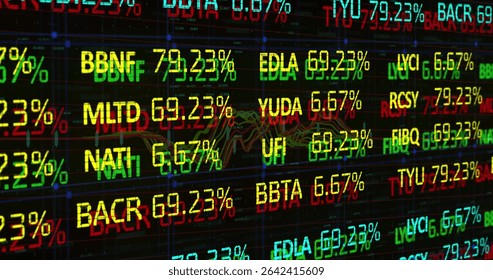
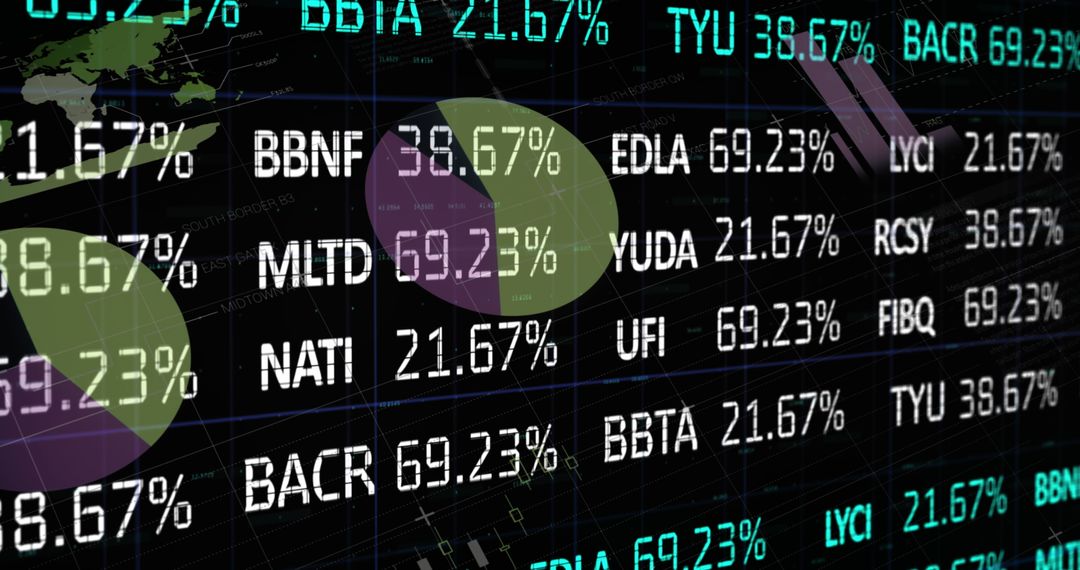
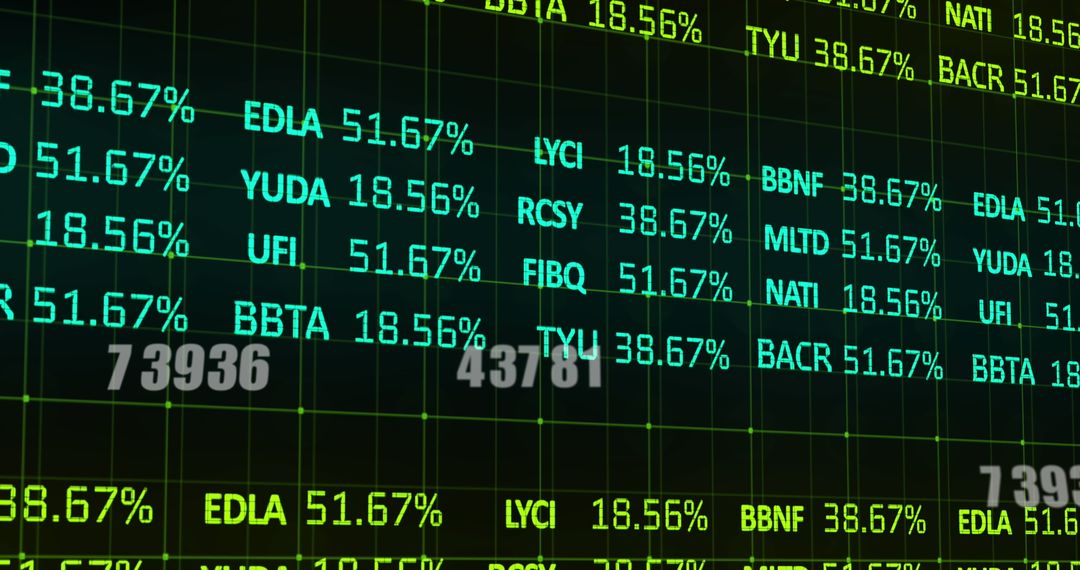
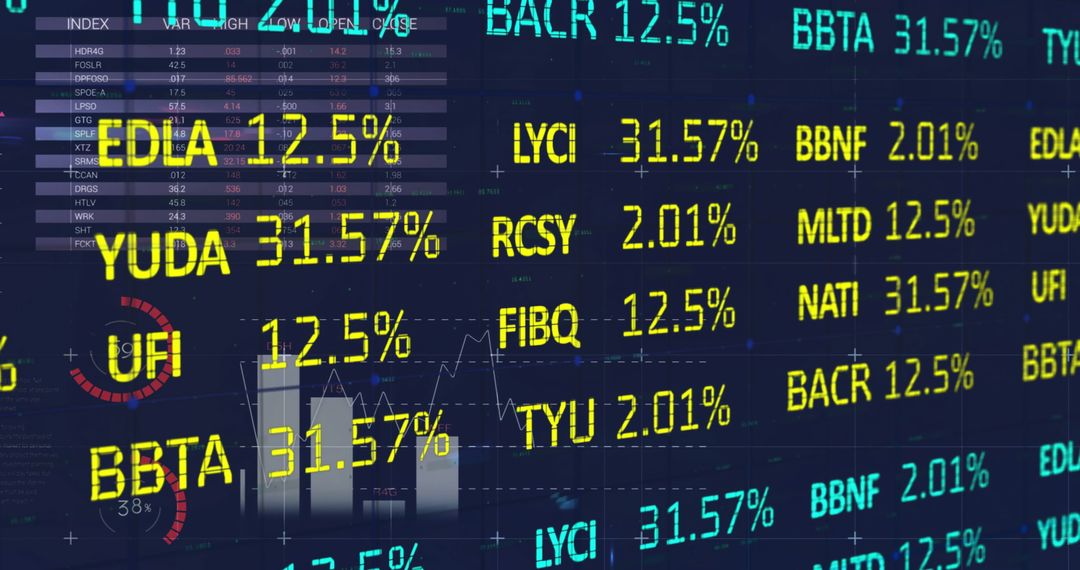
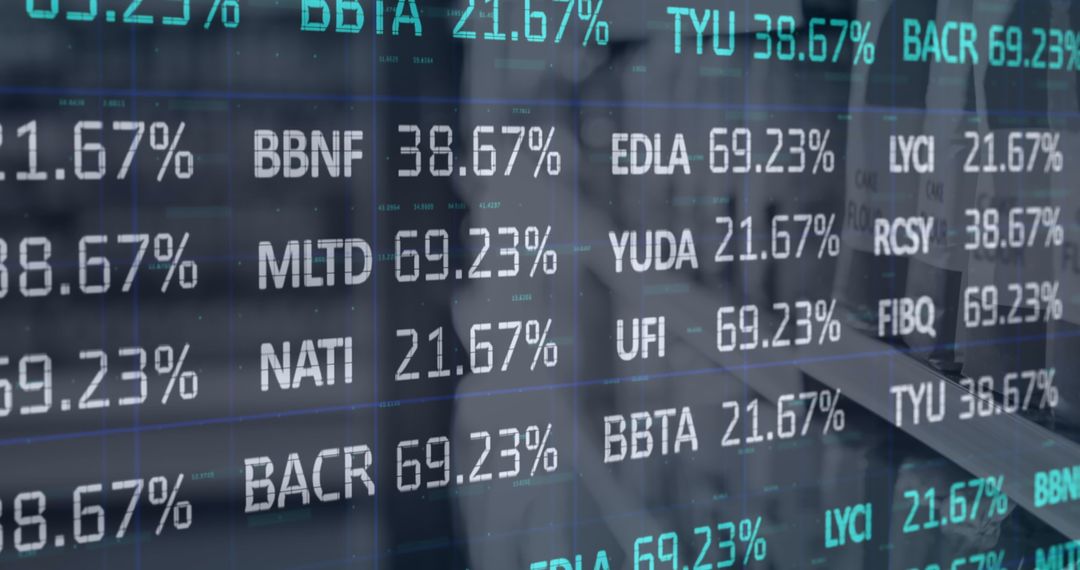
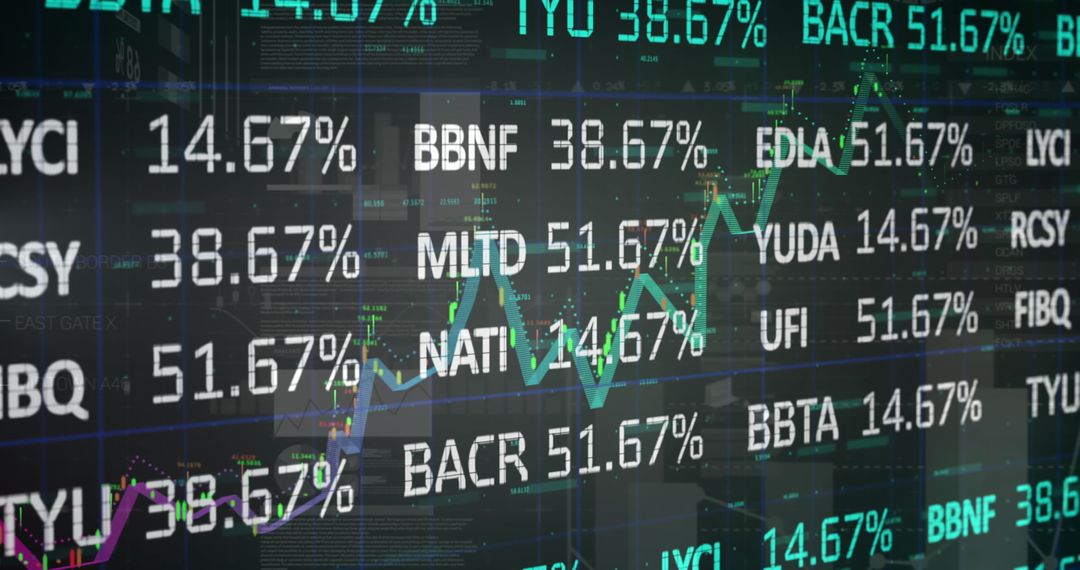
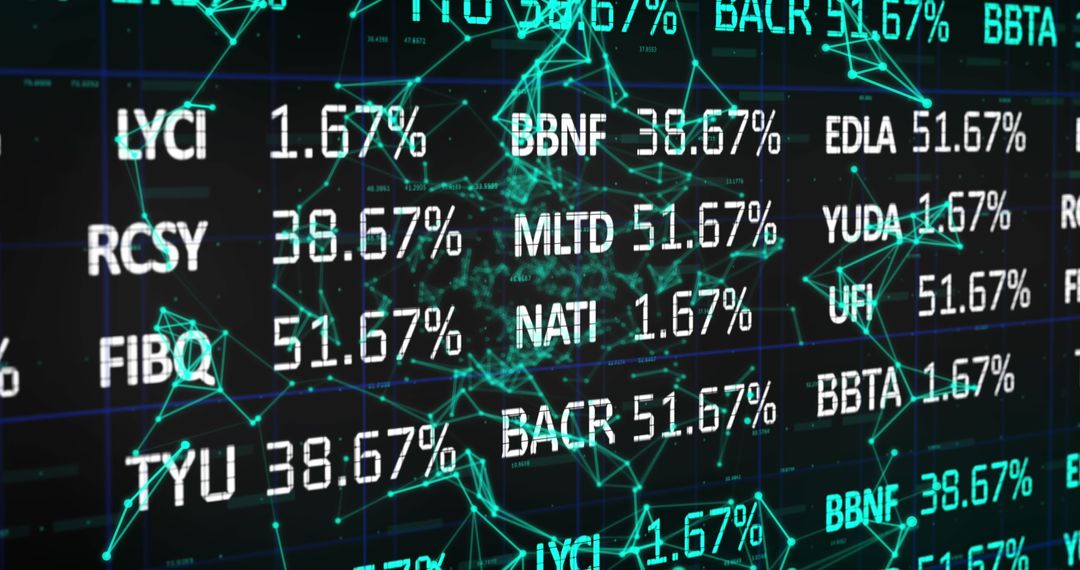
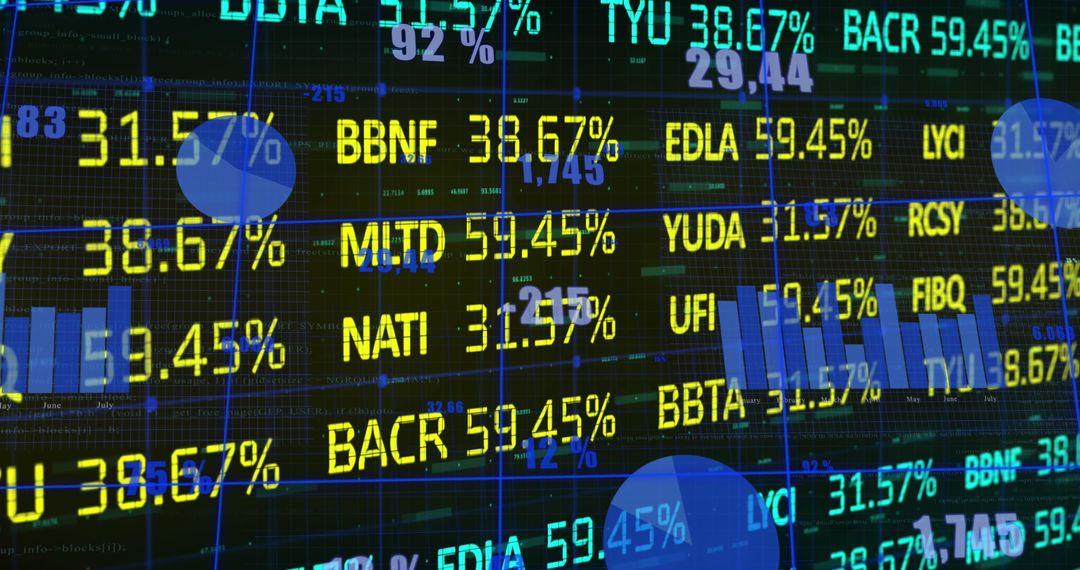
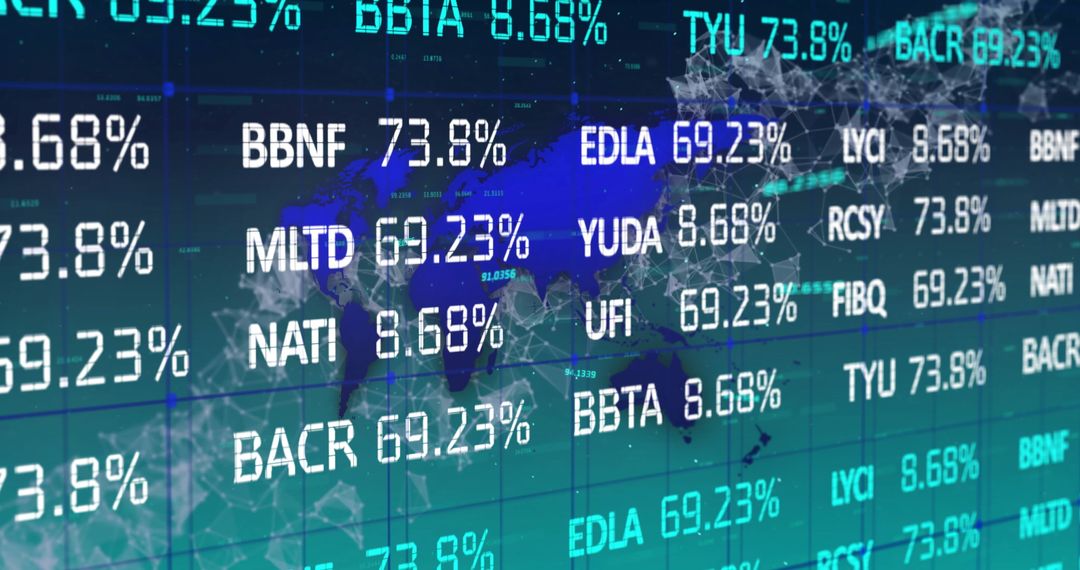
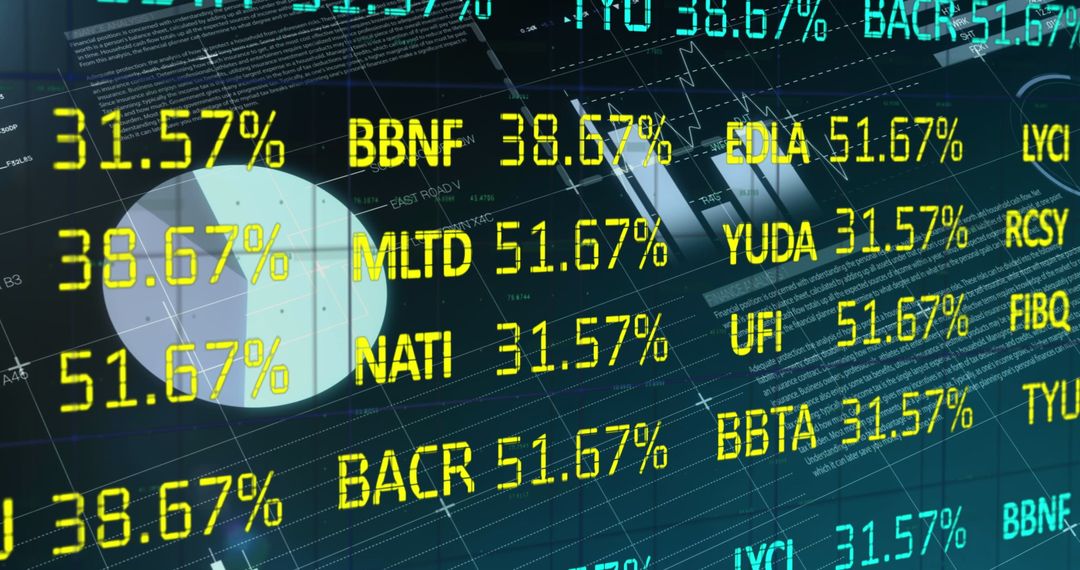
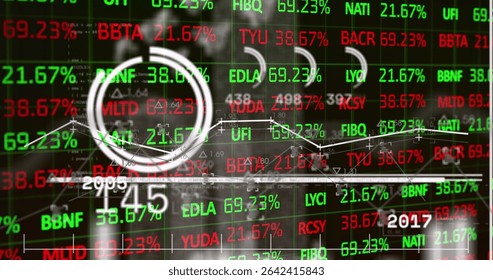
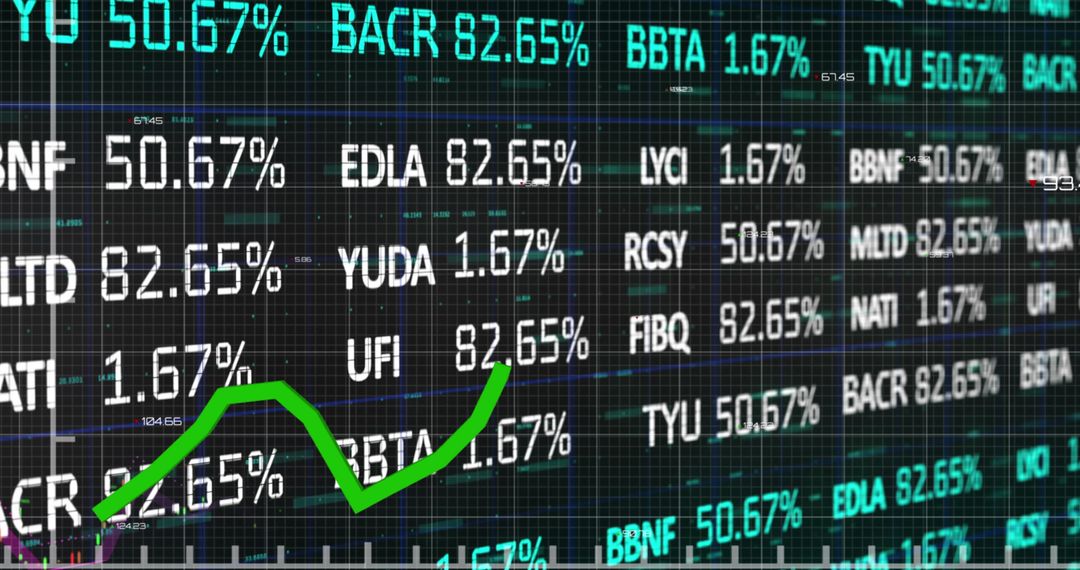
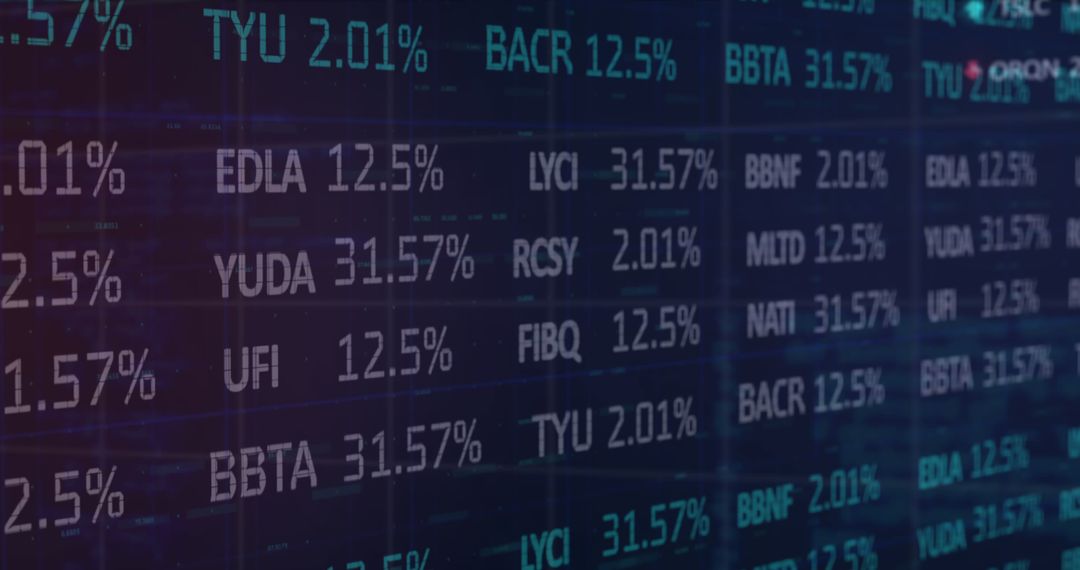
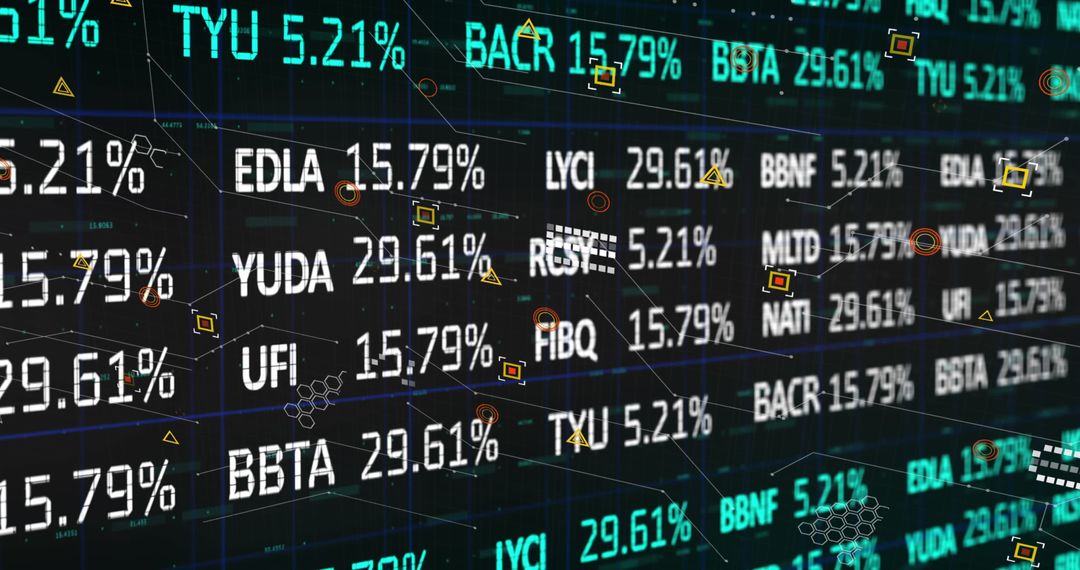
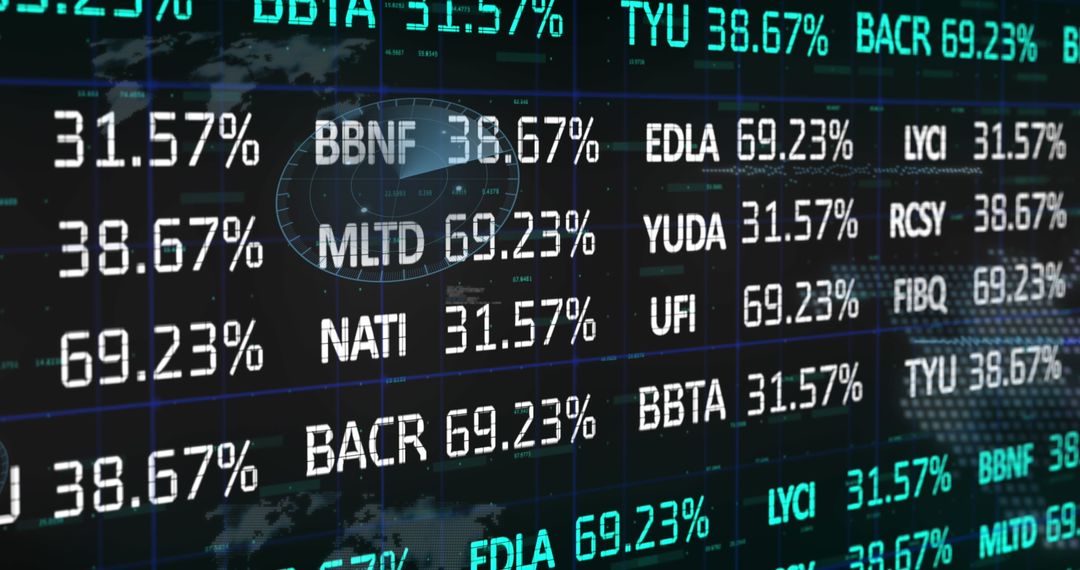
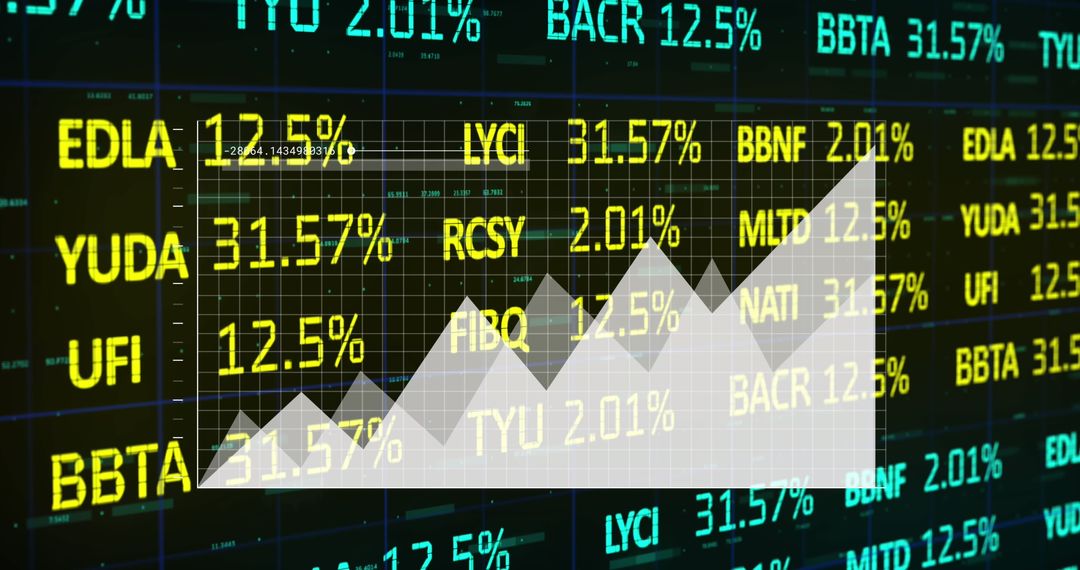
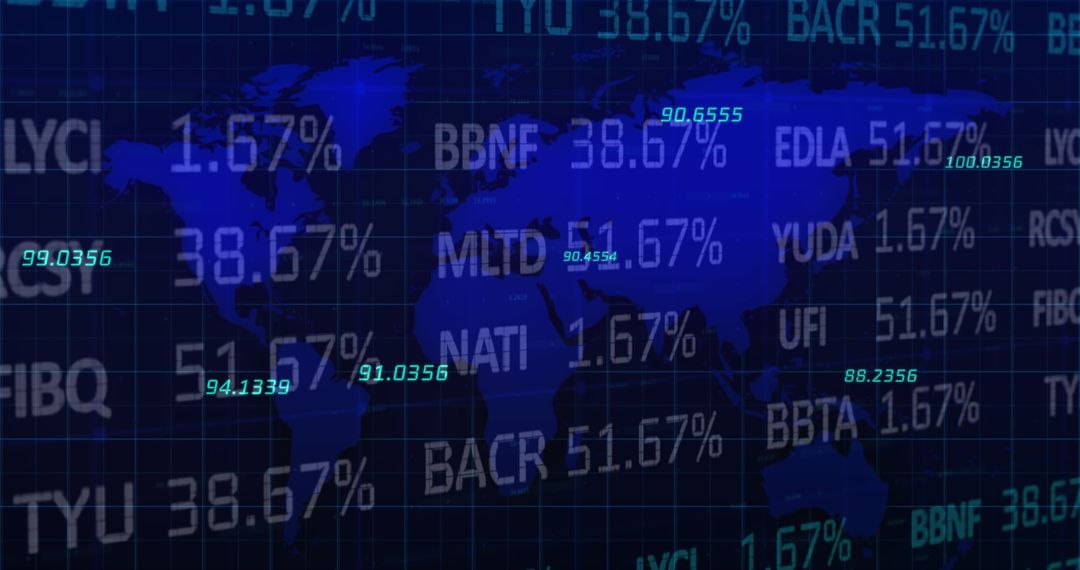
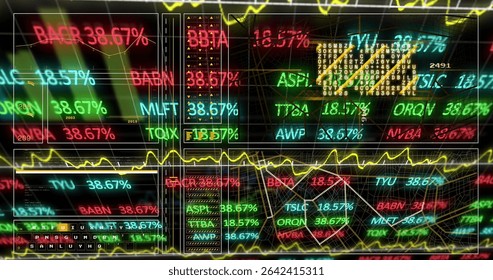
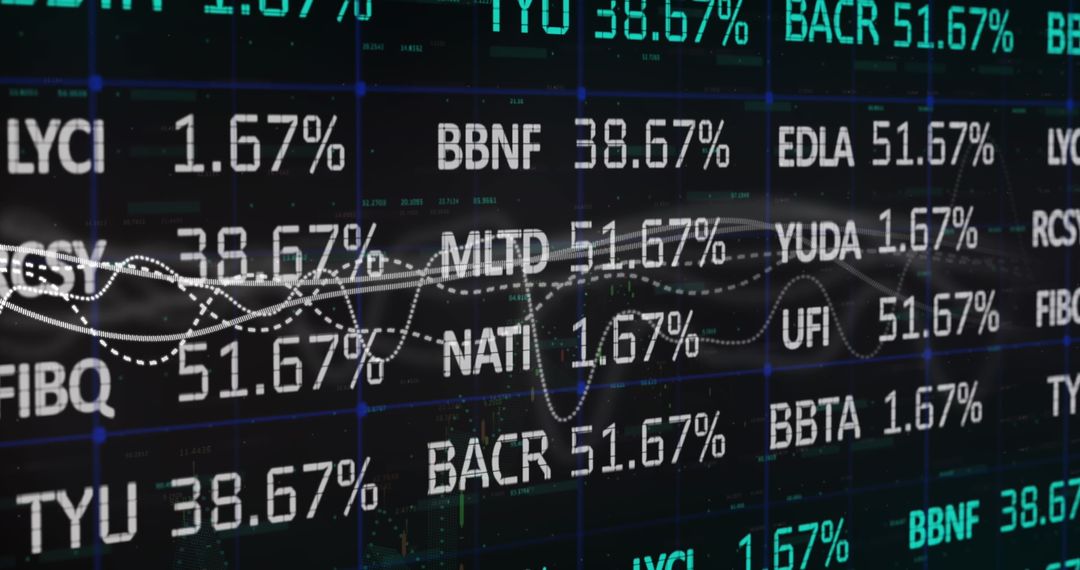
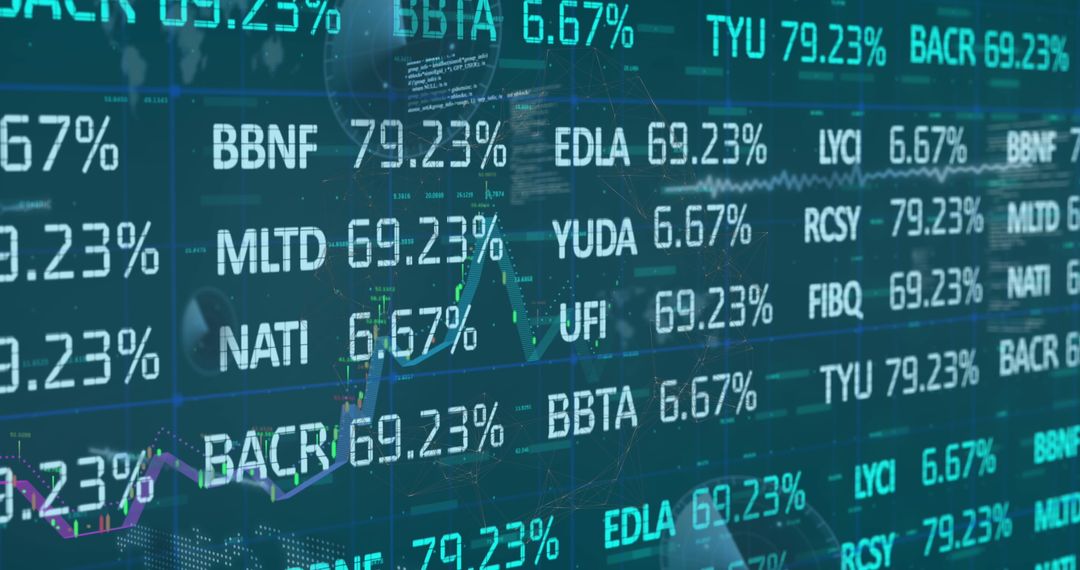
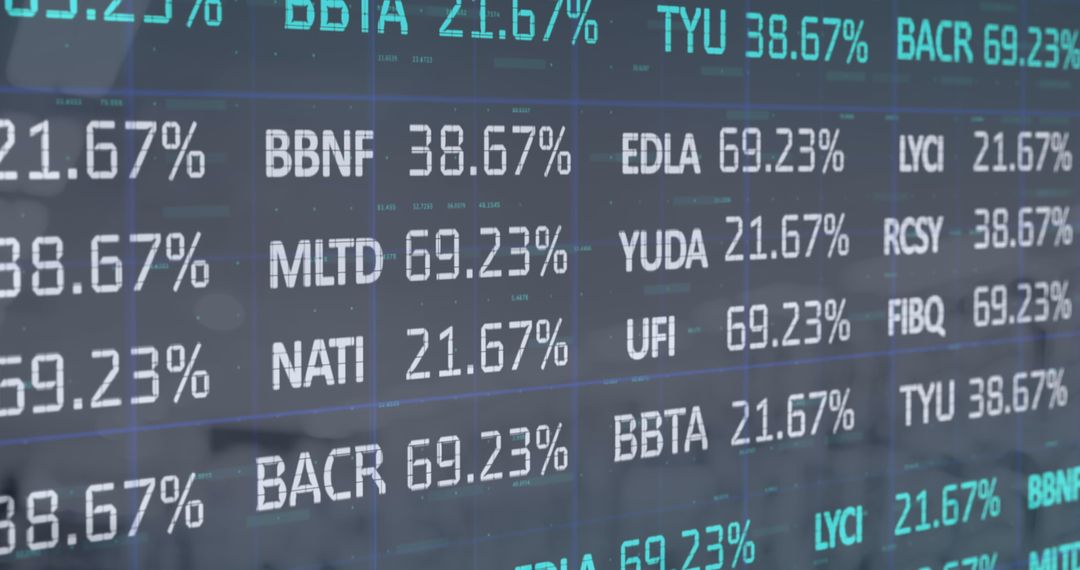
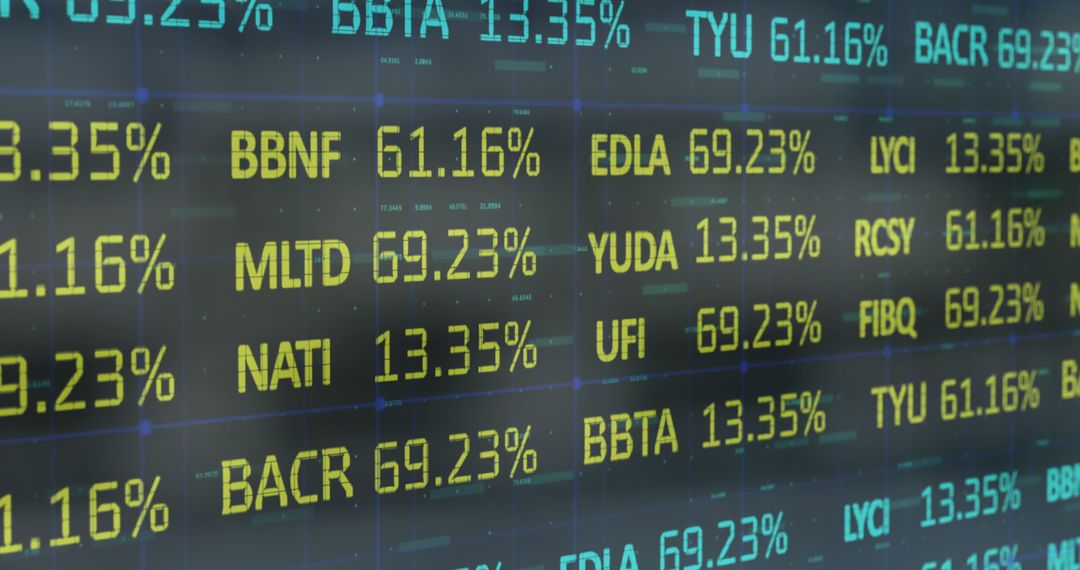
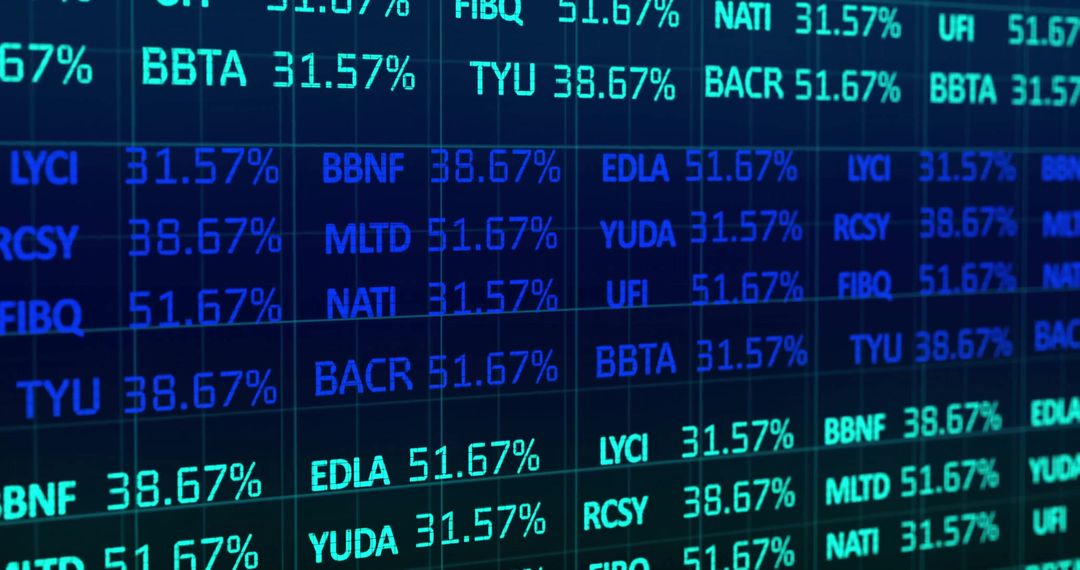
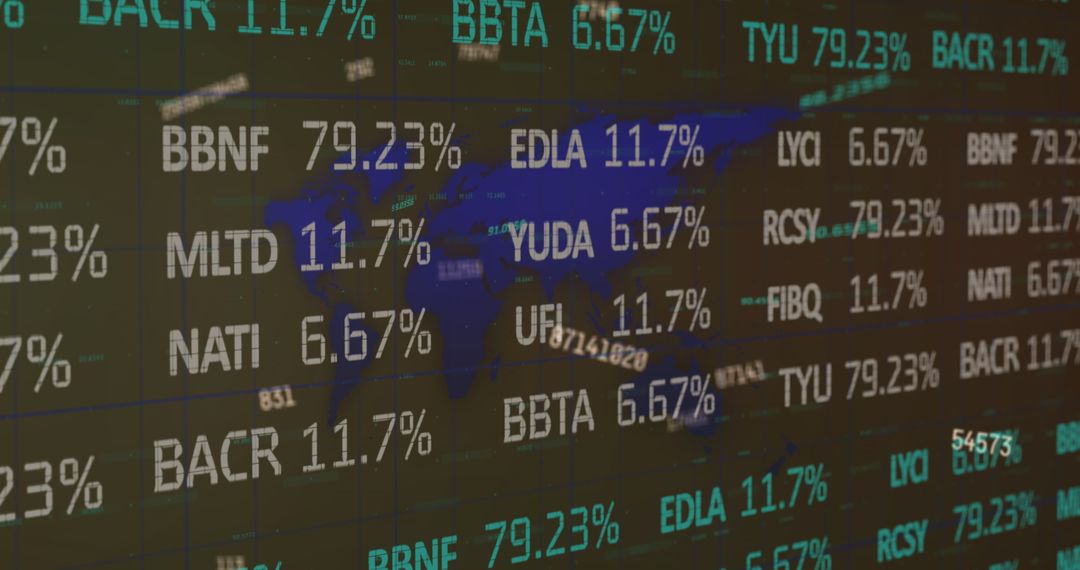
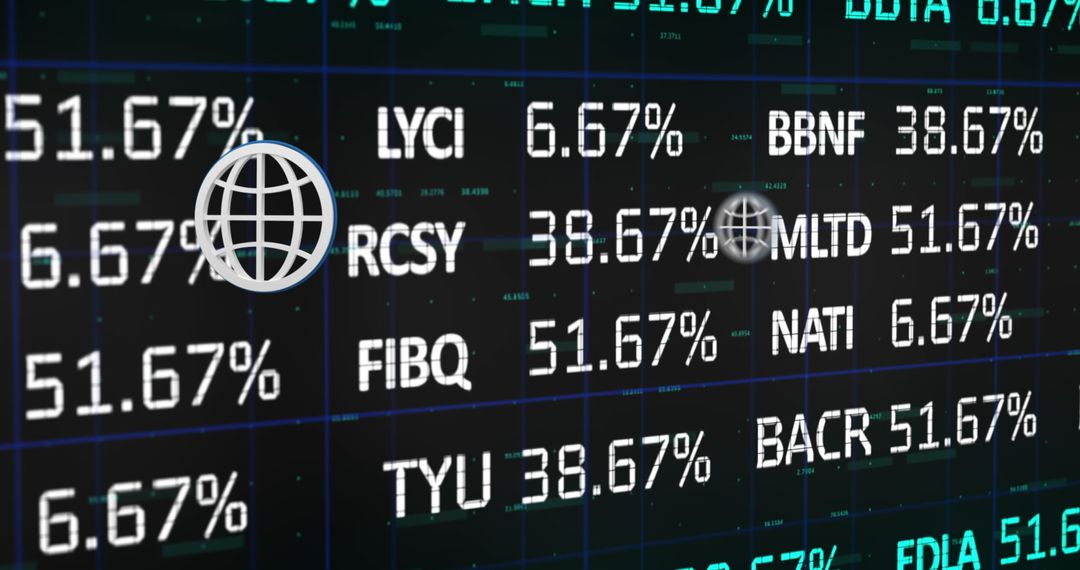
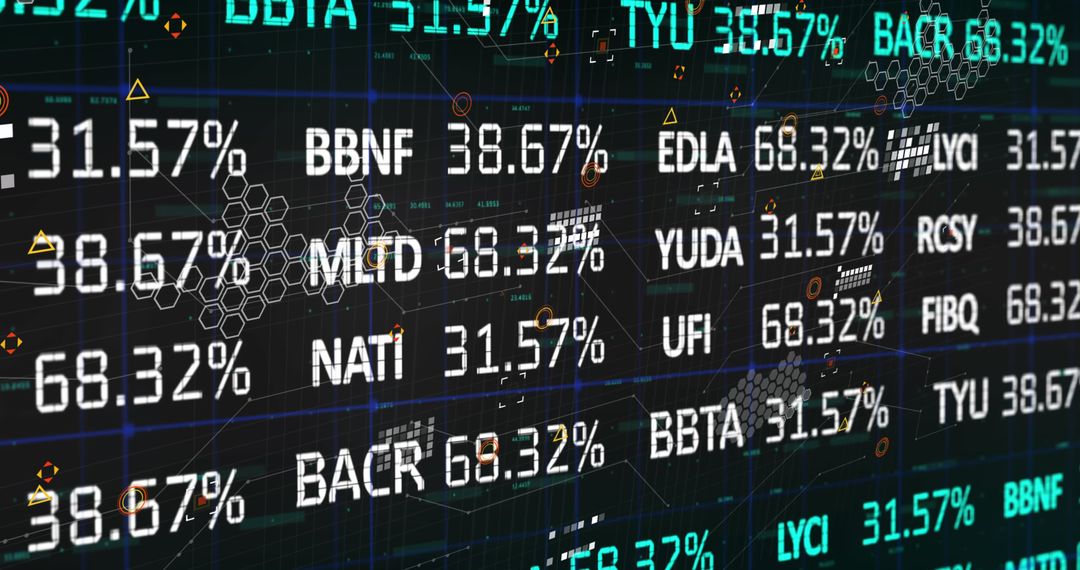
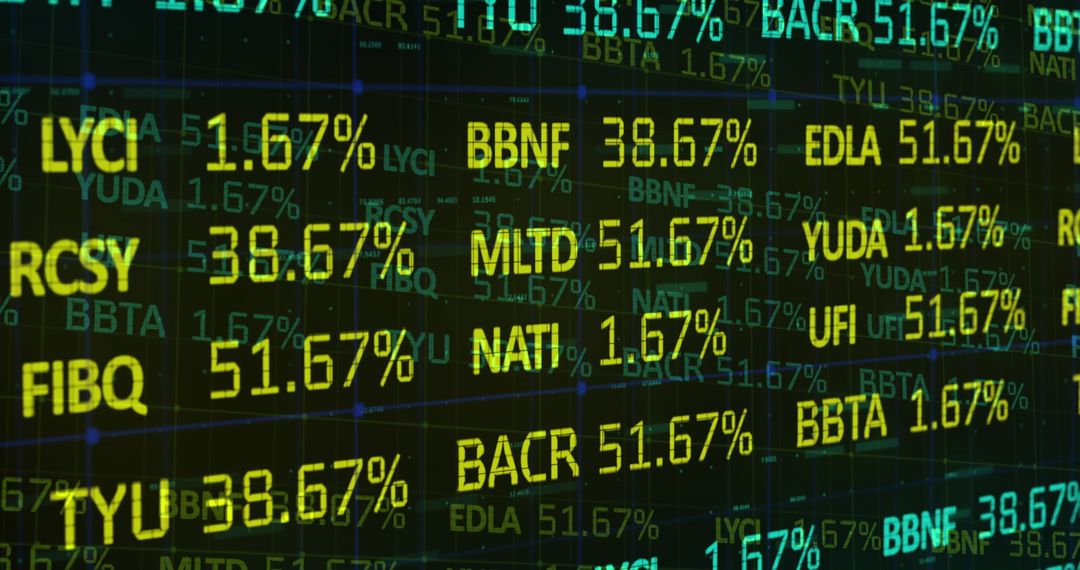
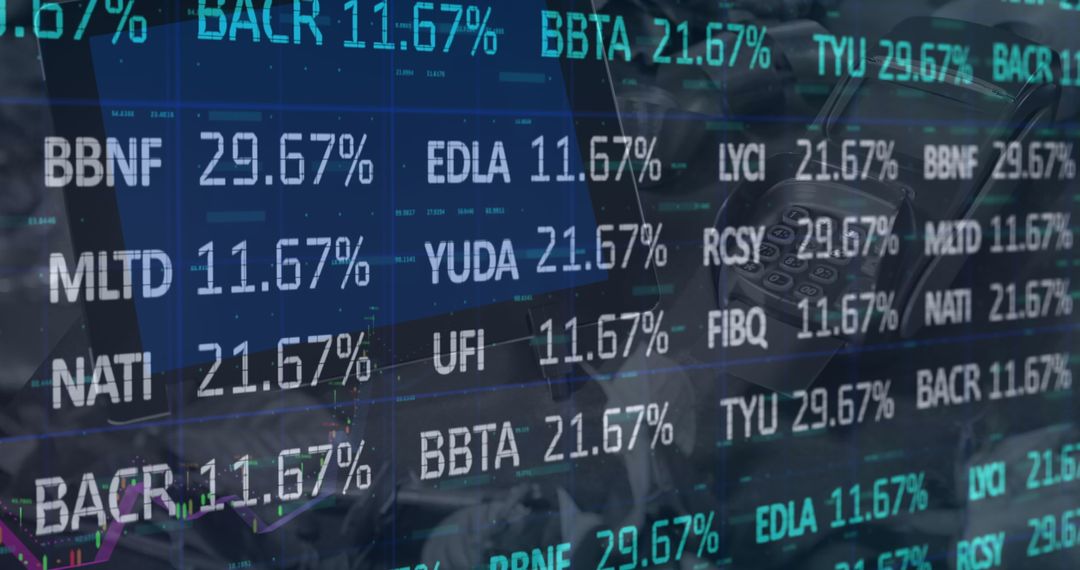
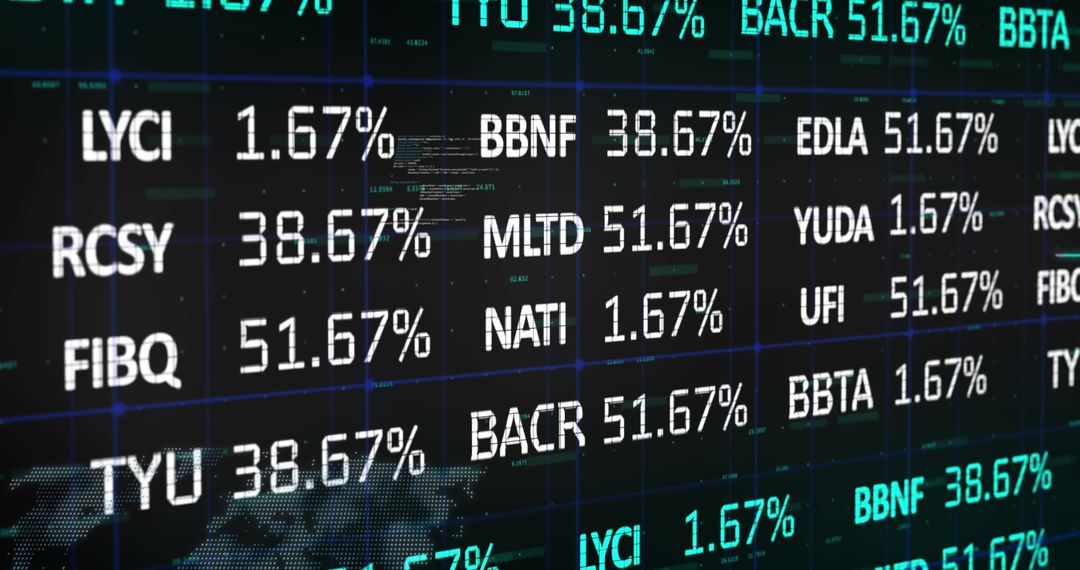
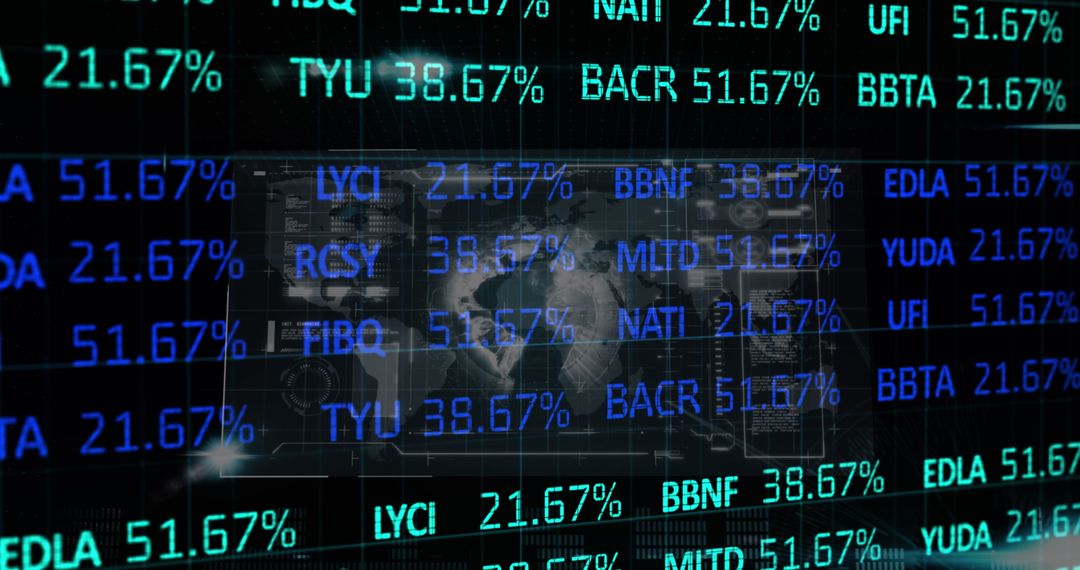
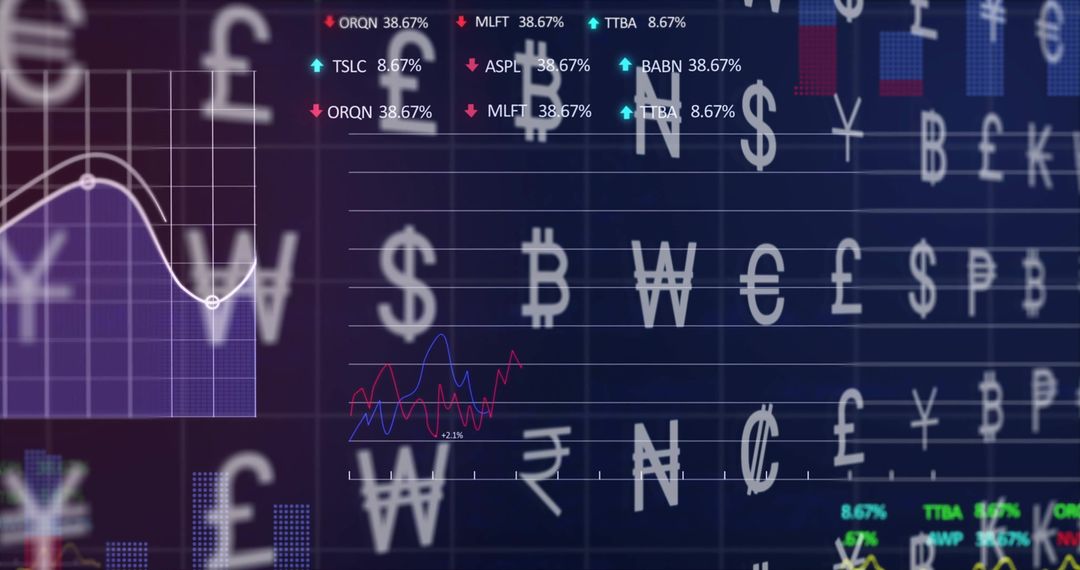
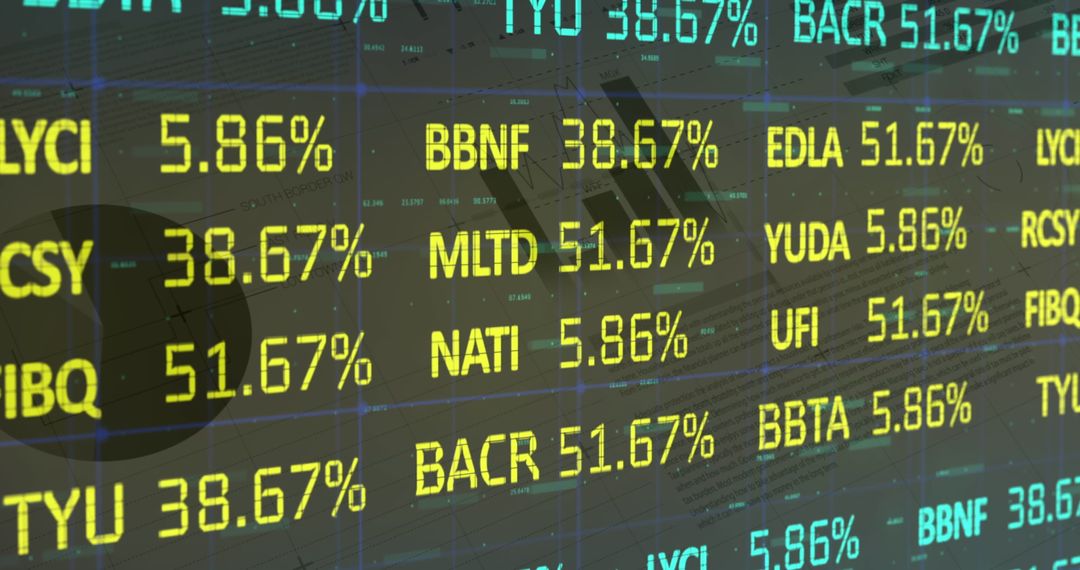
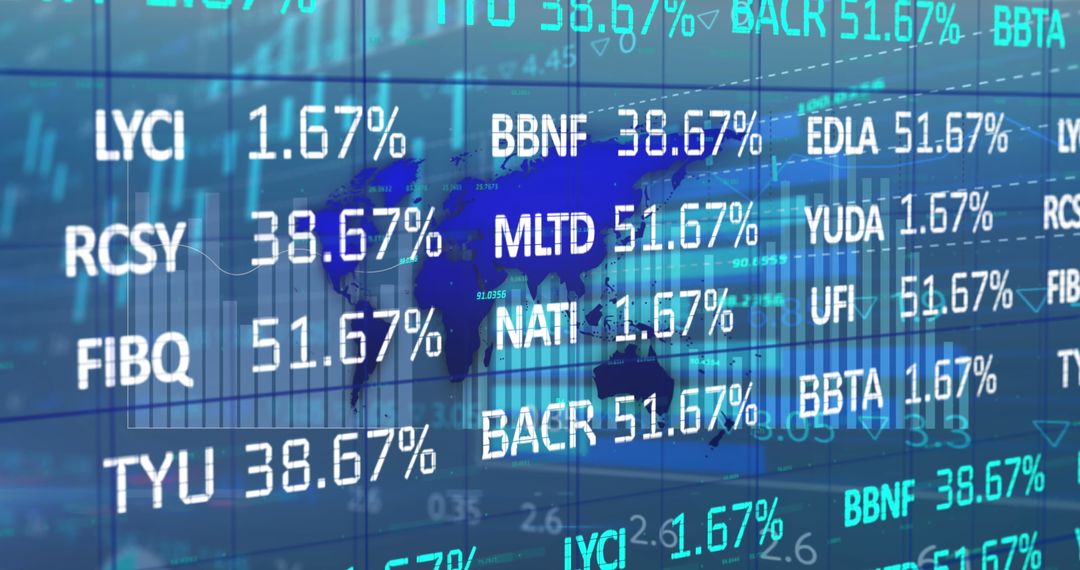
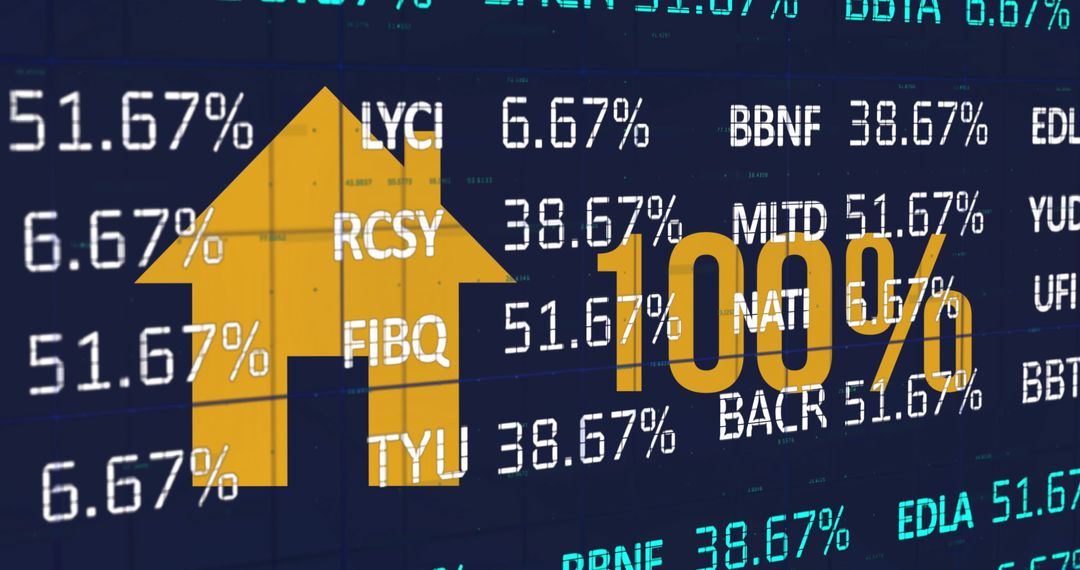
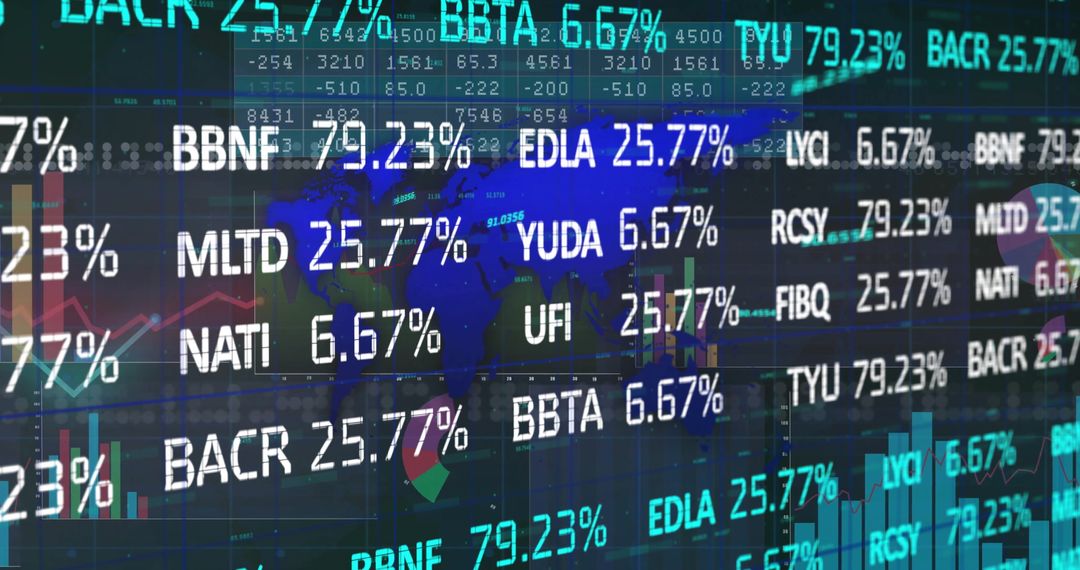
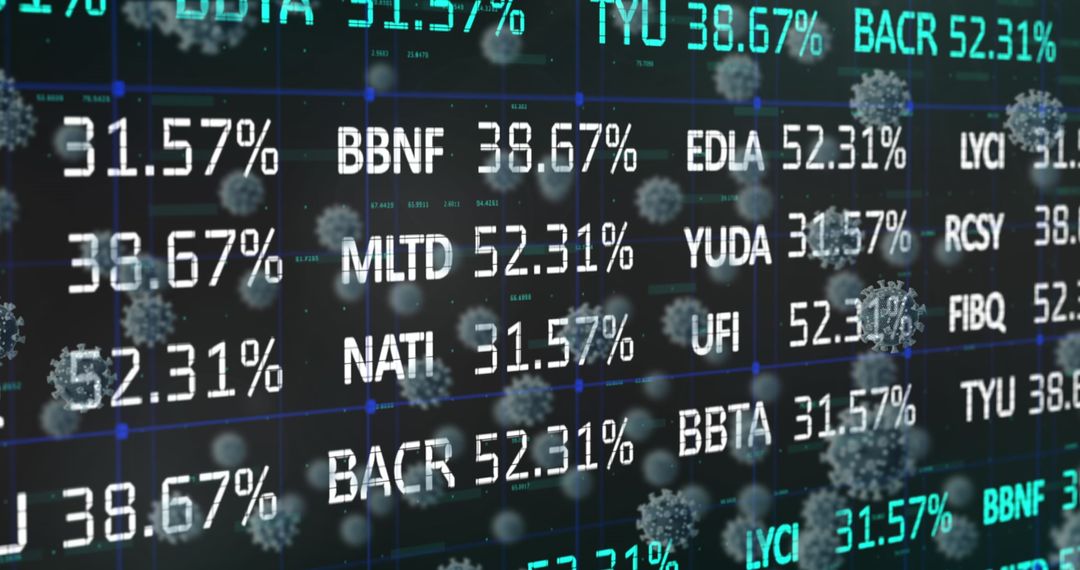
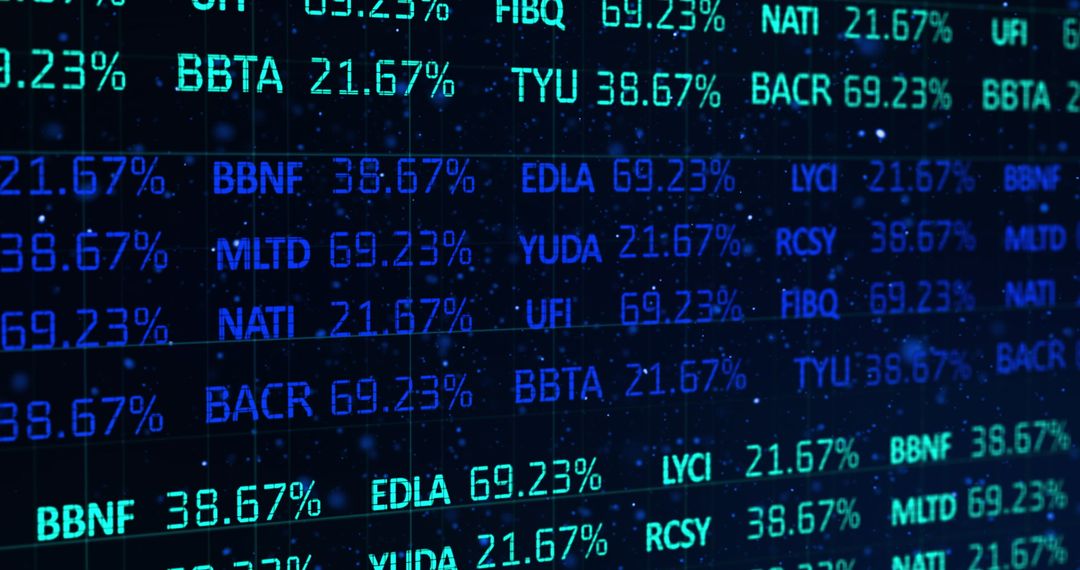
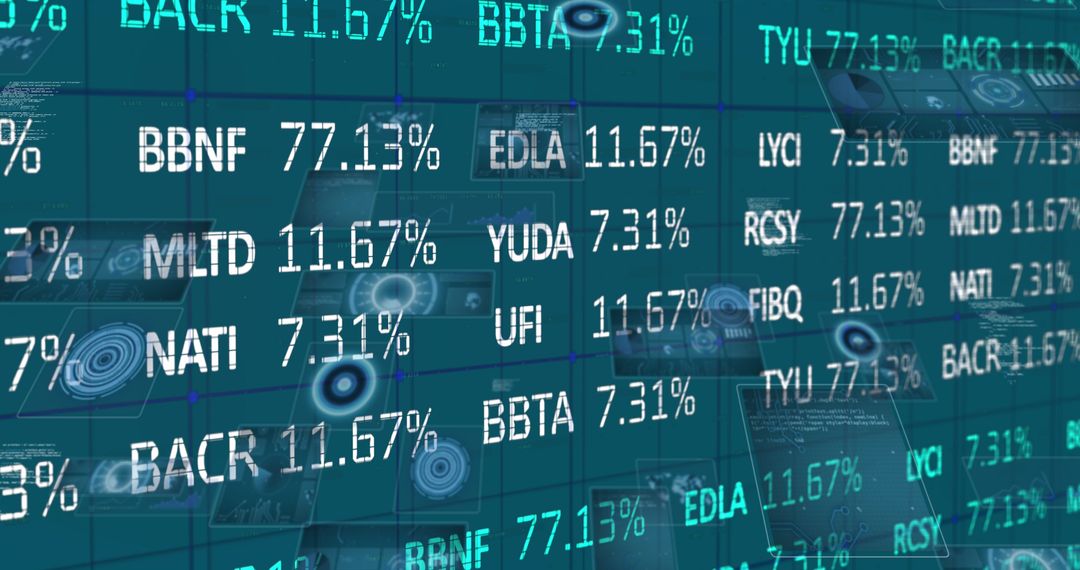
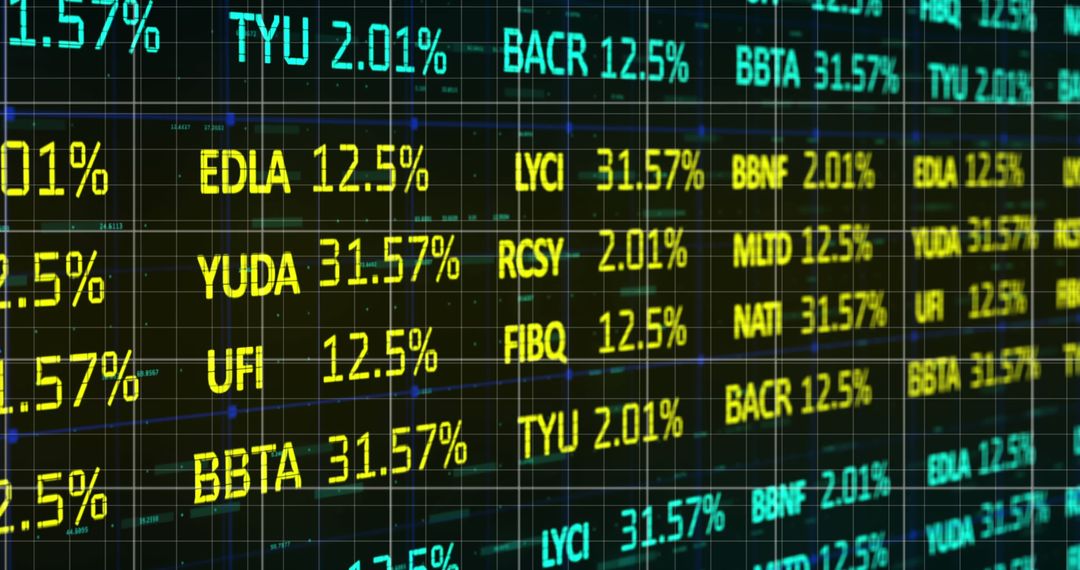
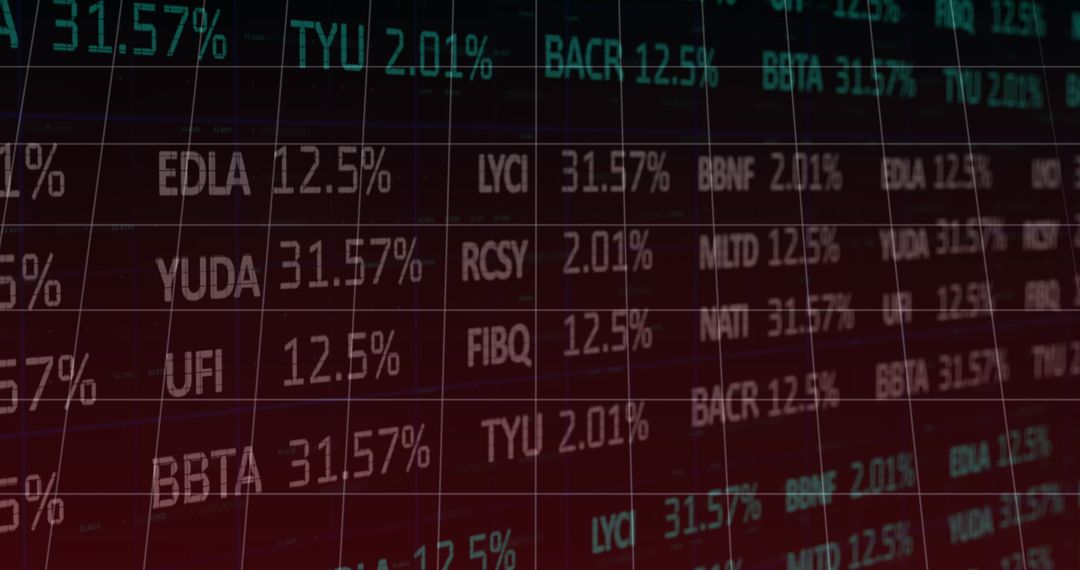
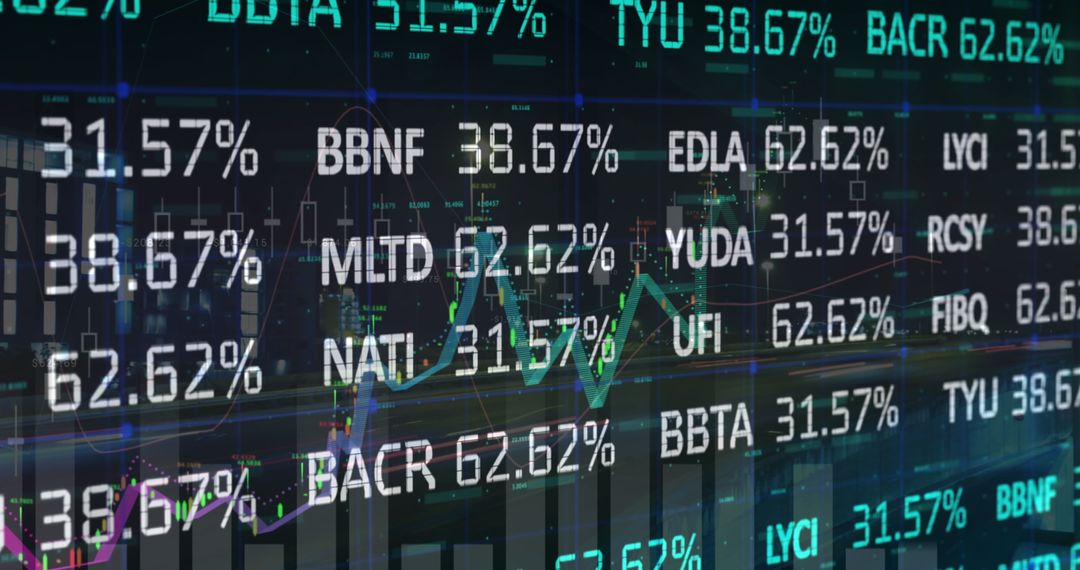
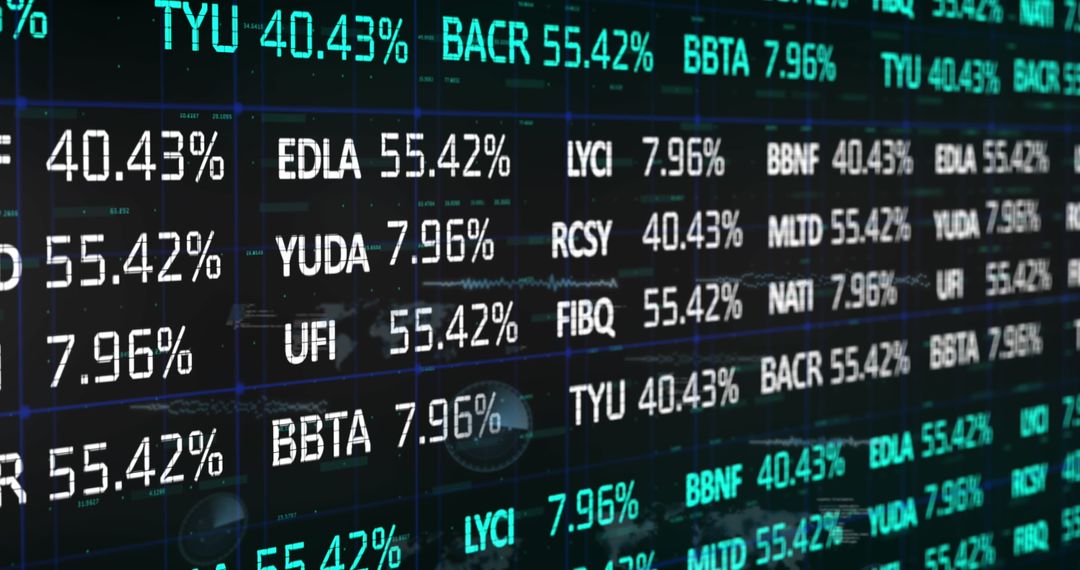
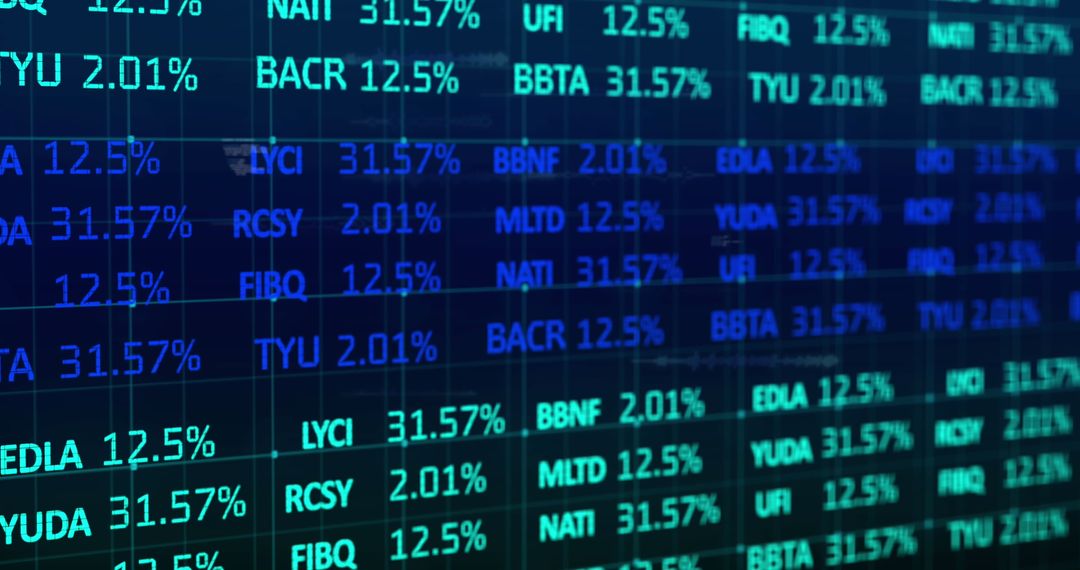
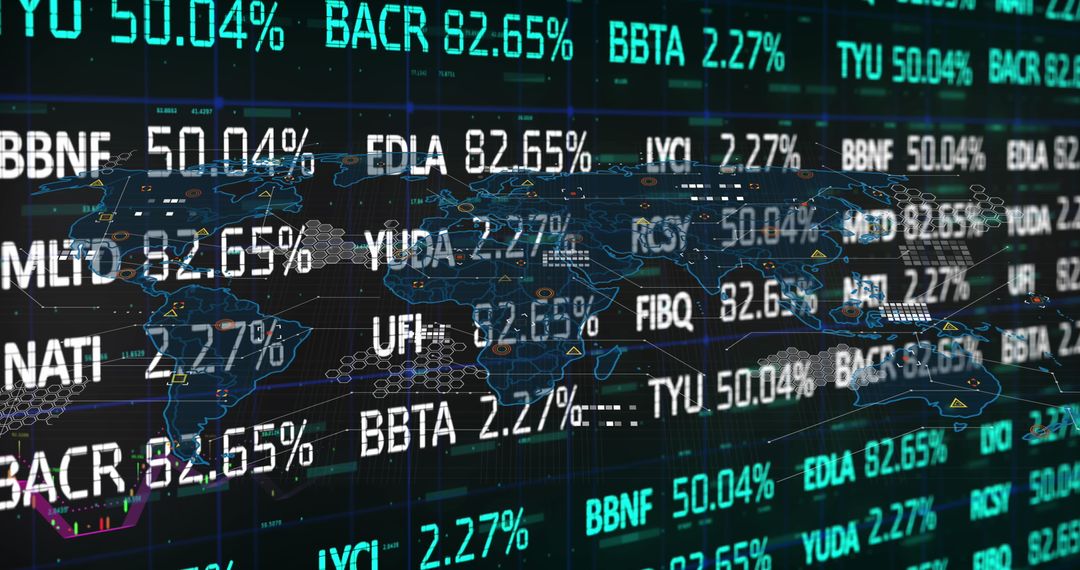
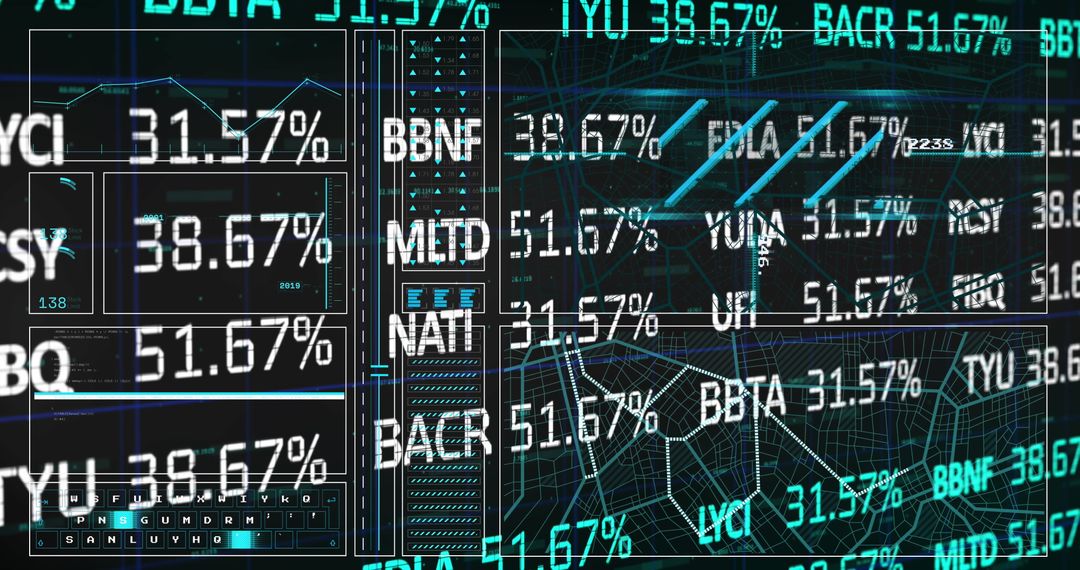
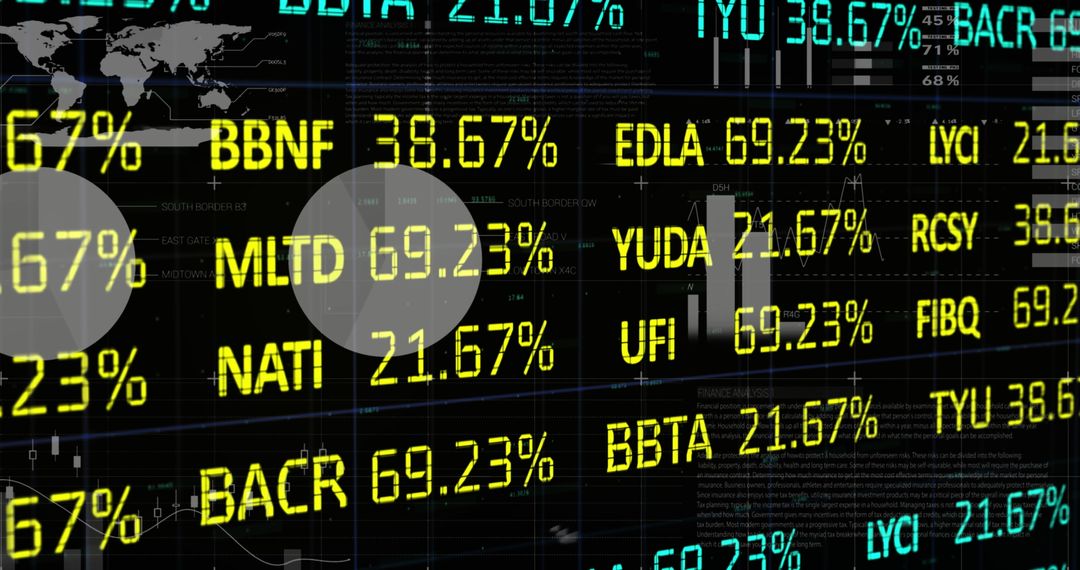
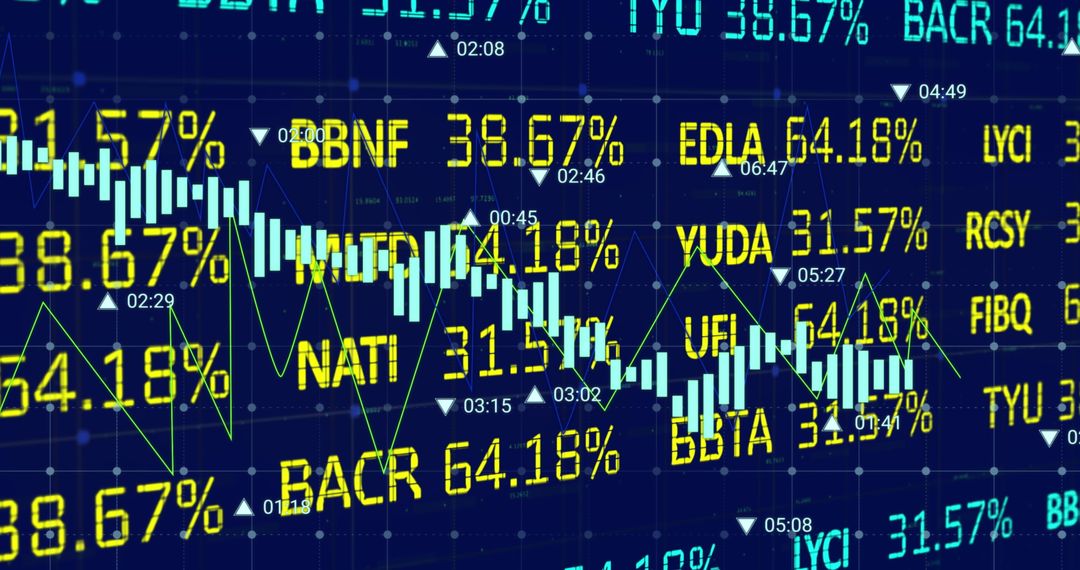
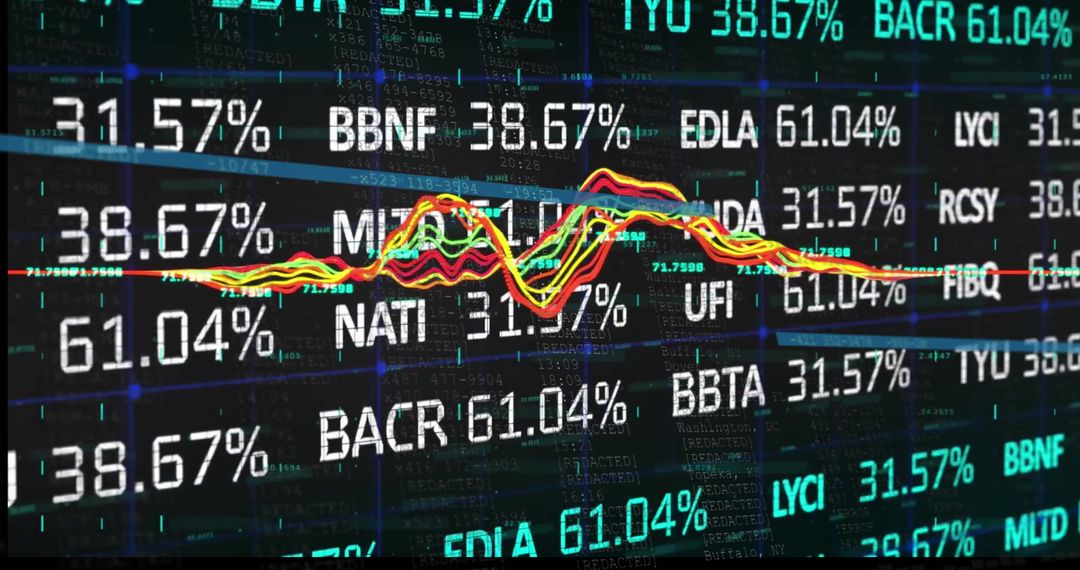
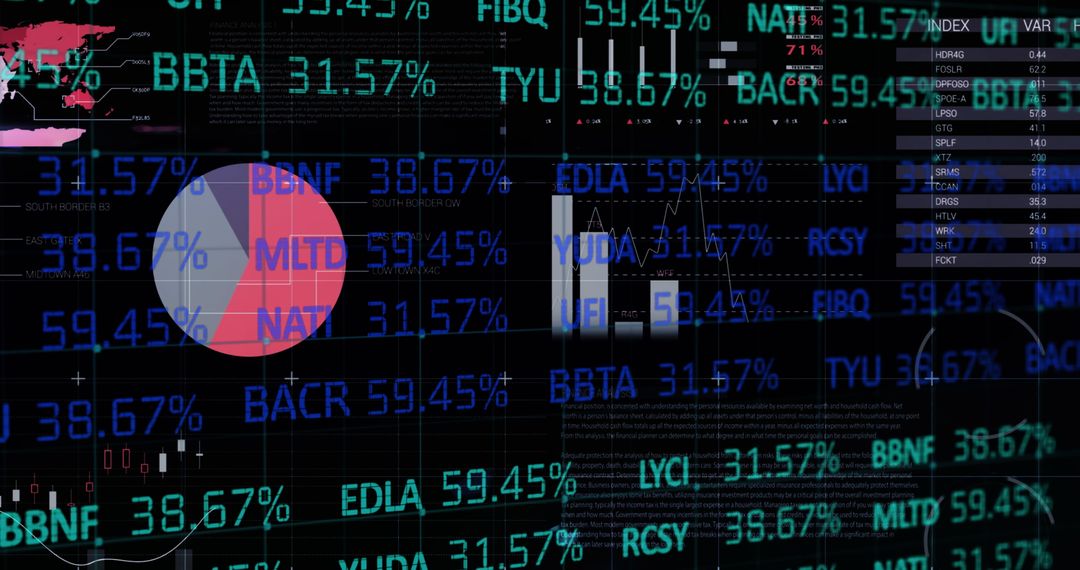
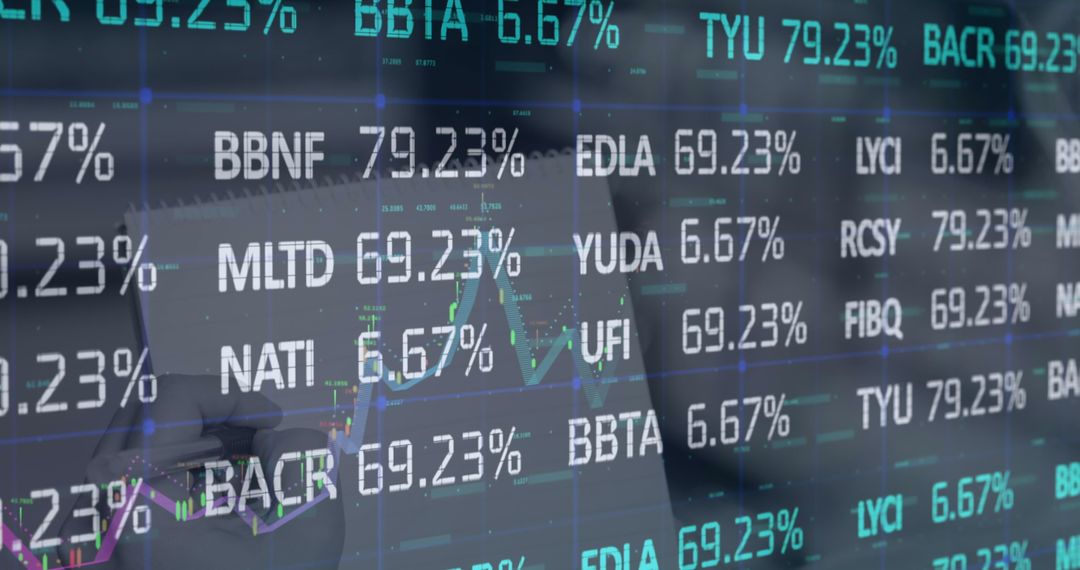
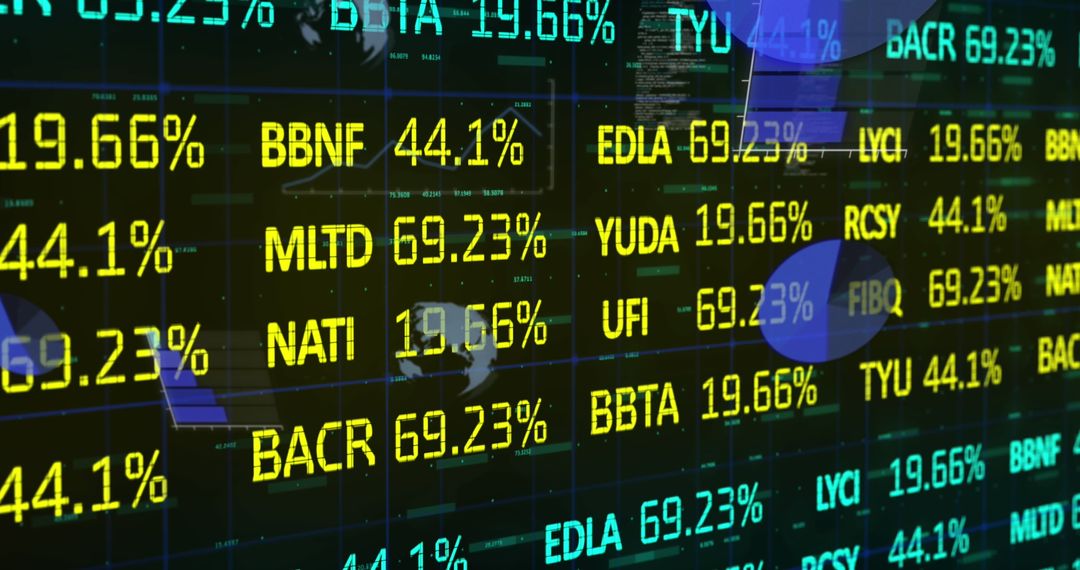
This digital composition demonstrates a modern financial dashboard with a focus on stock market analytics. Various stock ticker symbols and percentage readouts are layered over a dark grid interface, conveying dynamic market activity in real time. The addition of charts and graphical elements enhances the visual appeal and provides insights into growth trends. Such visuals are ideal for articles, presentations, and content related to finance, investment strategies, or economic forecasts. This can also be used in technology or innovation topics highlighting advancements in financial analytics and data interpretation.
Powered by  - Get 15% off with code: PIKWIZARD15


2
downloads
downloads
Tags:
More
Credit Photo
If you would like to credit the Photo, here are some ways you can do so
Text Link
photo Link
<span class="text-link">
<span>
<a target="_blank" href=https://pikwizard.com/photo/financial-dashboard-display-with-stock-tickers-and-analytics-graphs/ce8c831553c7cc63180258f95edd2ecd/>PikWizard</a>
</span>
</span>
<span class="image-link">
<span
style="margin: 0 0 20px 0; display: inline-block; vertical-align: middle; width: 100%;"
>
<a
target="_blank"
href="https://pikwizard.com/photo/financial-dashboard-display-with-stock-tickers-and-analytics-graphs/ce8c831553c7cc63180258f95edd2ecd/"
style="text-decoration: none; font-size: 10px; margin: 0;"
>
<img src="https://pikwizard.com/pw/medium/ce8c831553c7cc63180258f95edd2ecd.jpg" style="margin: 0; width: 100%;" alt="" />
<p style="font-size: 12px; margin: 0;">PikWizard</p>
</a>
</span>
</span>
Free (free of charge)
Free for personal and commercial use.
Author: Awesome Content
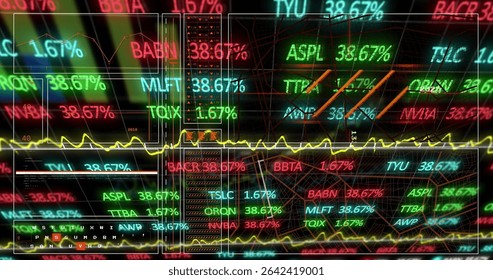
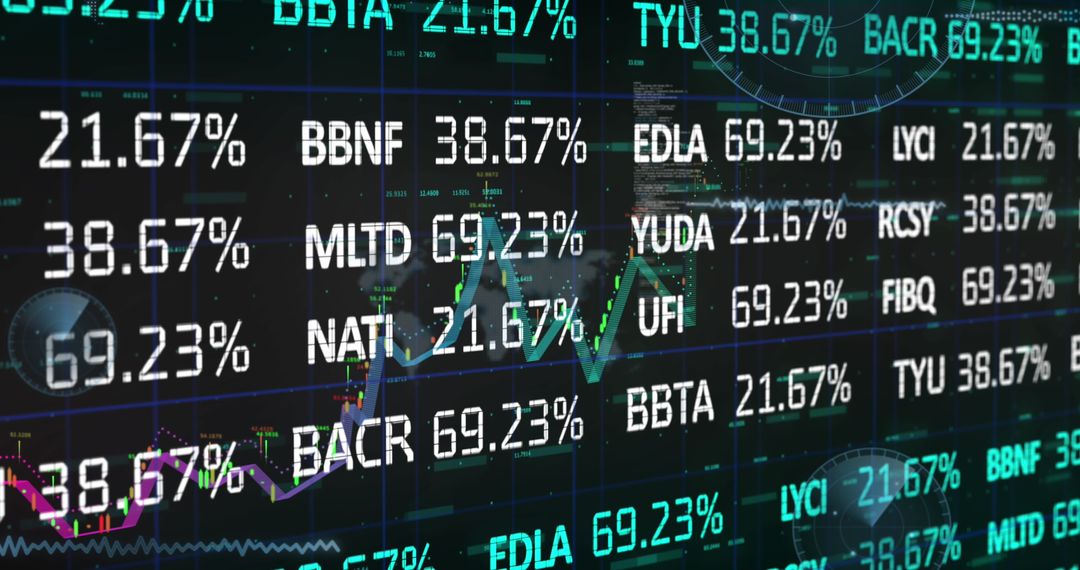
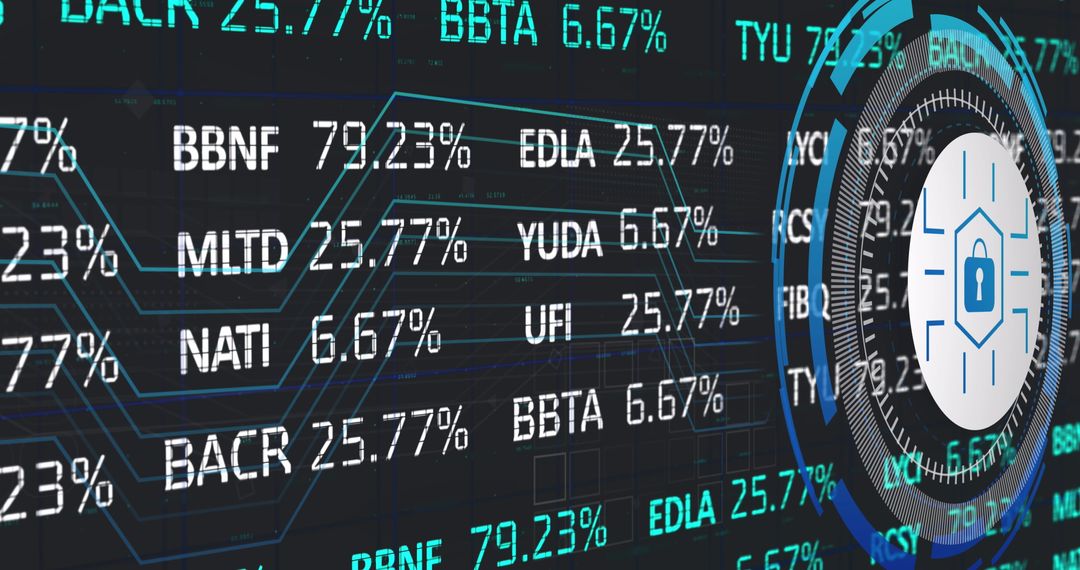
Similar Free Stock Images
Premium


Premium


Premium
Premium


Premium


Premium


Premium

Premium
Premium


Premium


Premium


Premium


Premium


Premium

Premium

Premium


Premium


Premium


Premium


Premium

Premium


Premium


Premium


Premium