- Home >
- Stock Photos >
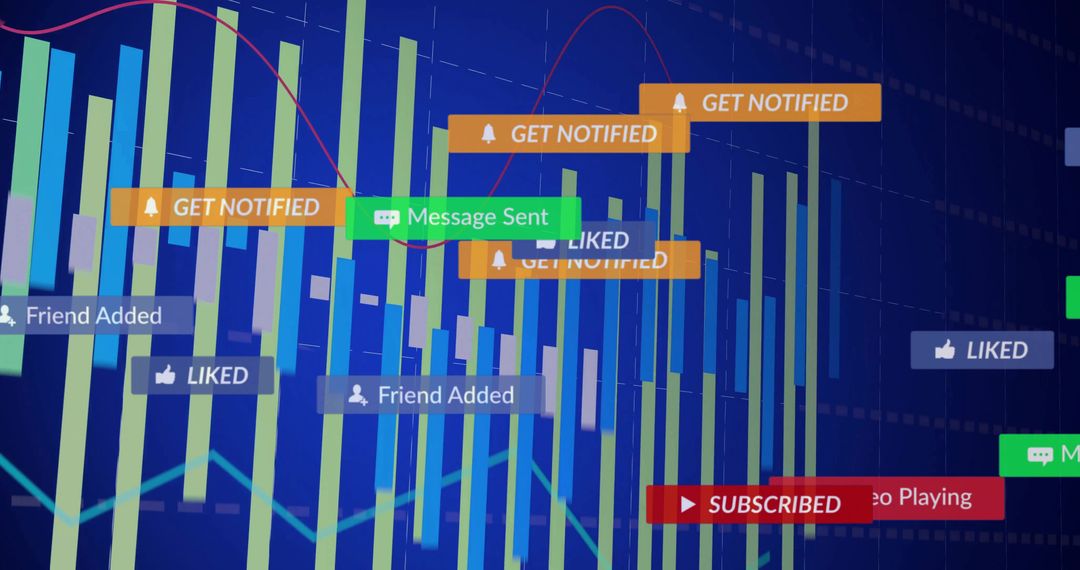
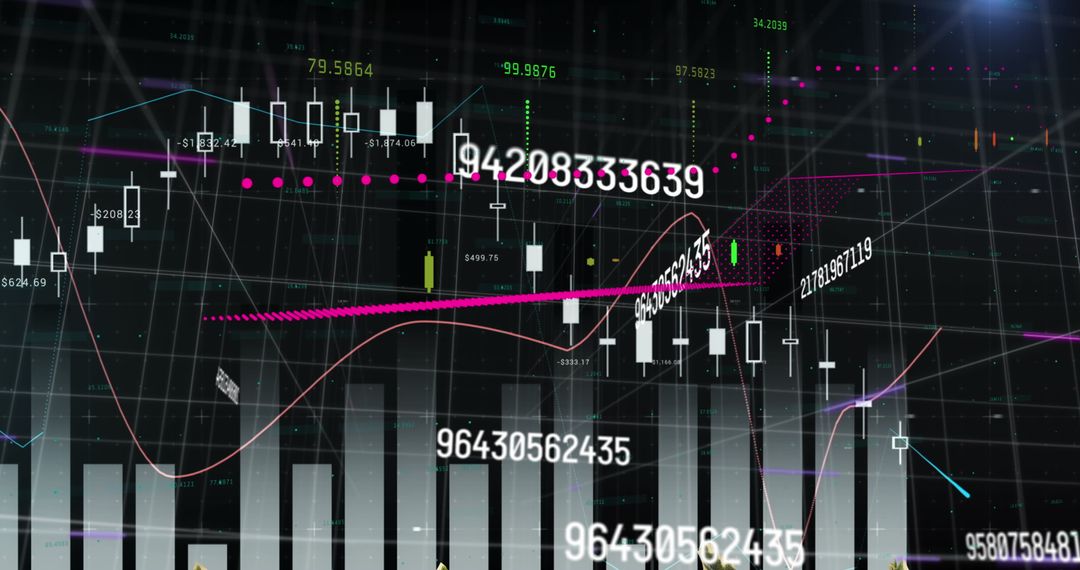
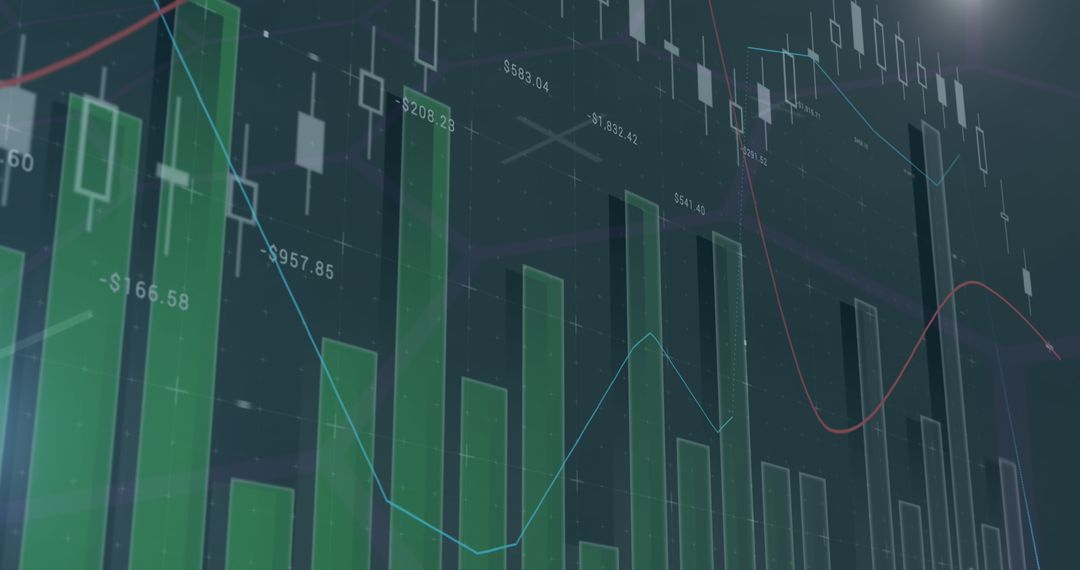
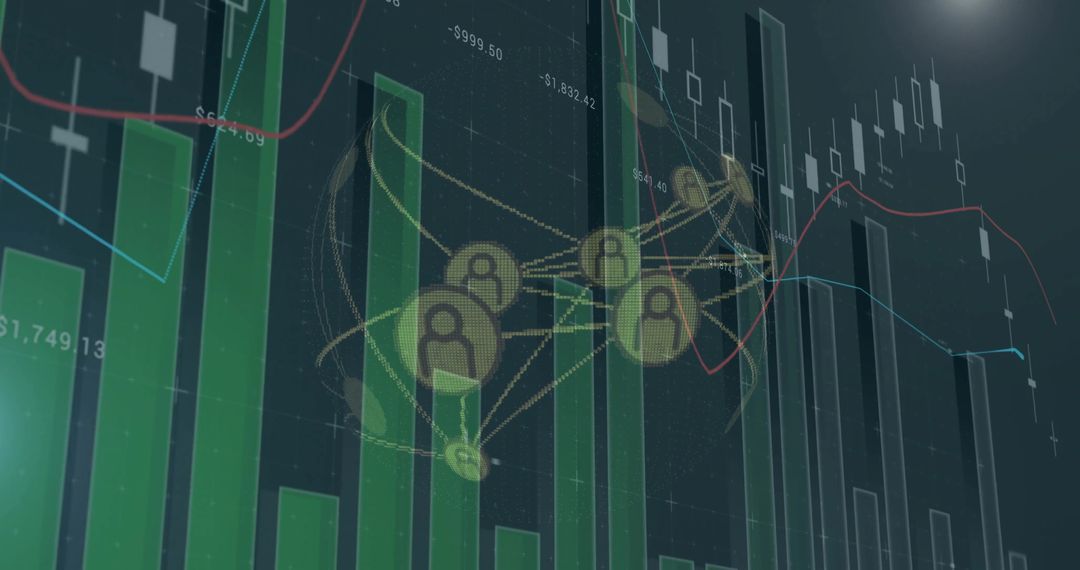
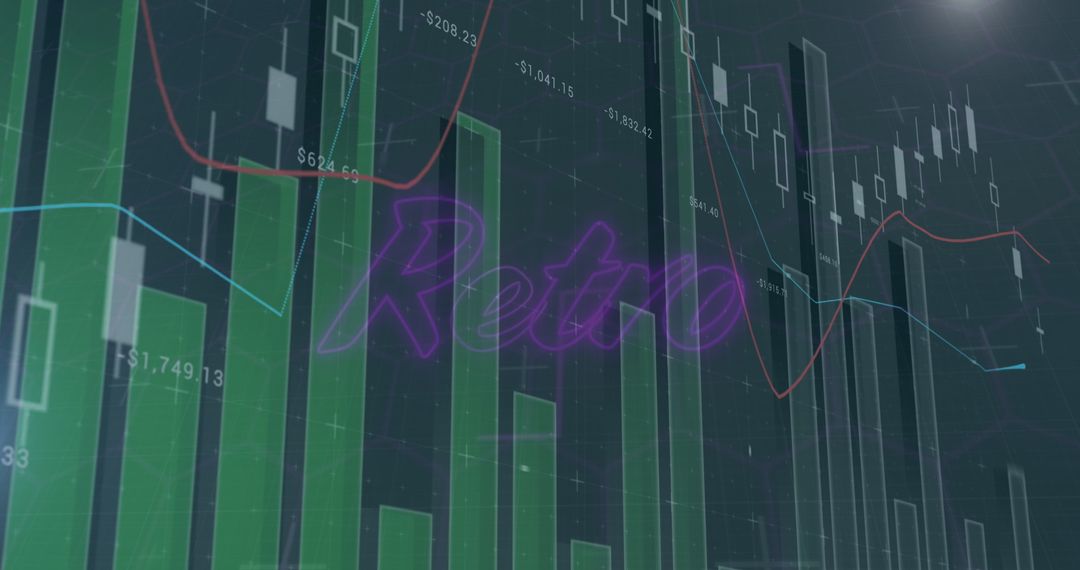
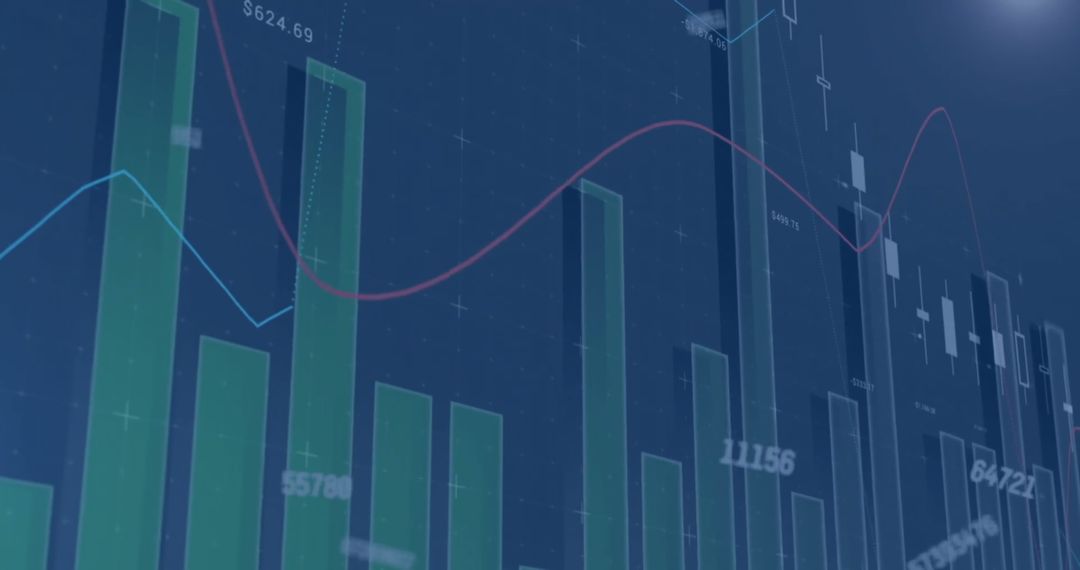
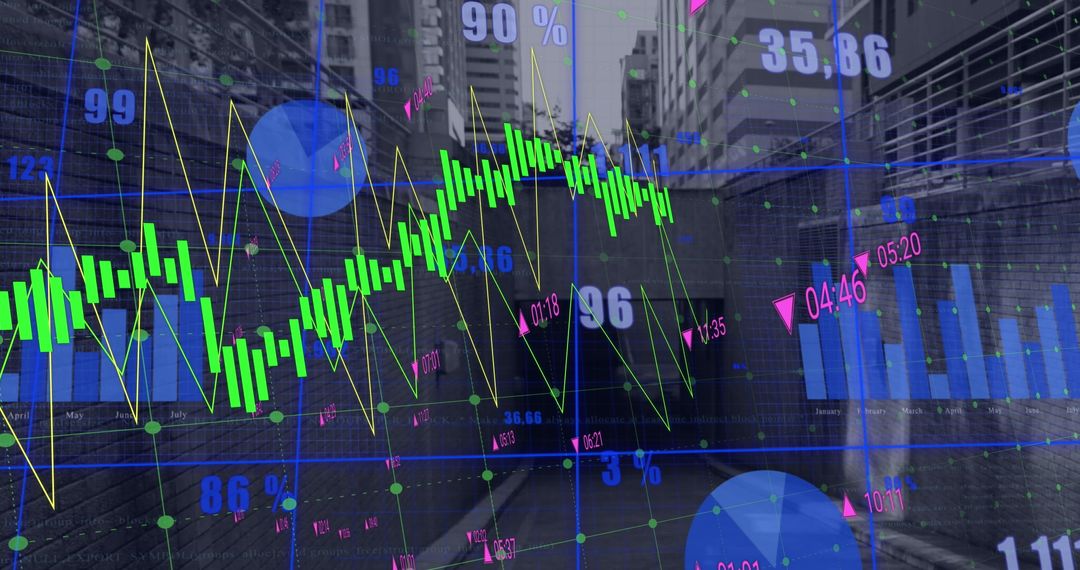
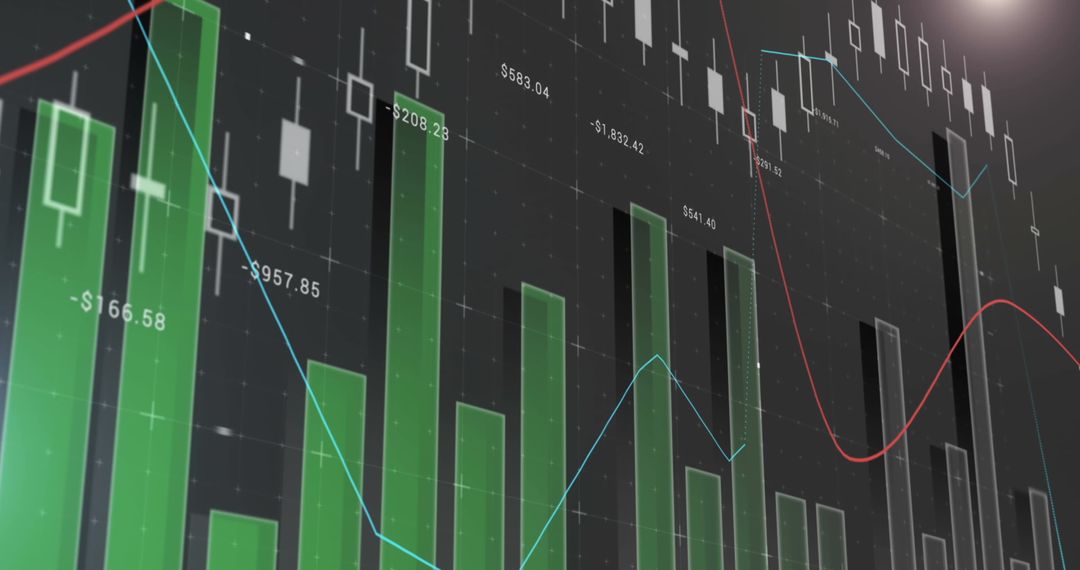
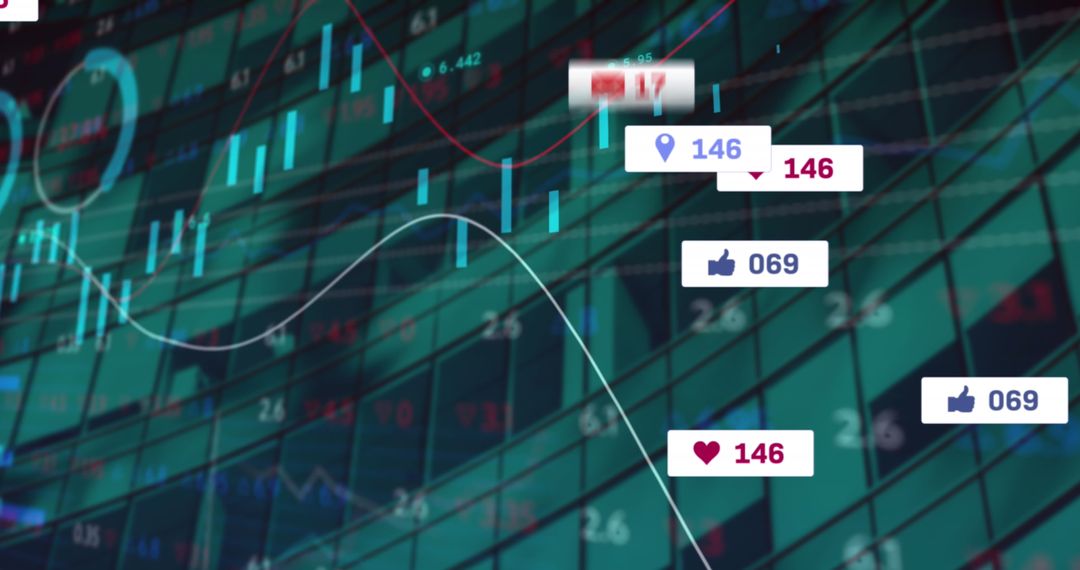
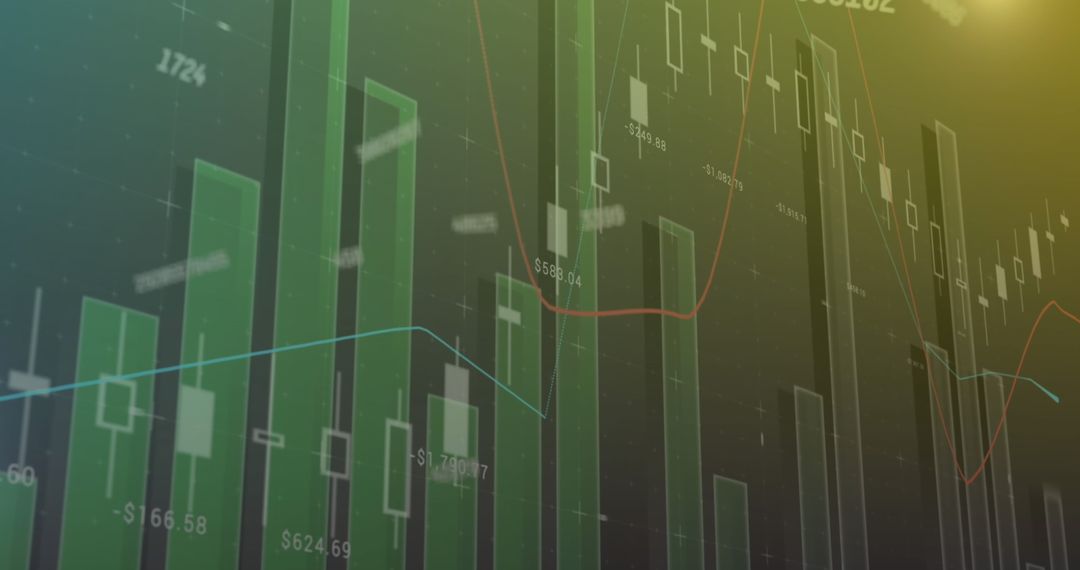
- Financial dashboard displaying candlestick and bar charts with market analytics overlays
Financial dashboard displaying candlestick and bar charts with market analytics overlays Image

Dark navy grid background creating high-contrast display of tall green bar graphs and translucent candlestick columns. Red and blue trend lines highlighting price movement while floating callouts displaying numeric metrics and user interaction icons. Clean modern composition suiting hero banners, fintech landing pages, investor reports, and trading platform dashboards. Graphic offering flexible space for overlay text, data labels, and branding elements while conveying high-tech, data-driven mood for professional finance audiences. Usage ideas including blog headers, presentation slides, marketing materials for brokerage and analytics firms, app UI mockups, and social media posts promoting market insights and trading education.
Powered by 


0
downloads
downloads
Tags:
More
Credit Photo
If you would like to credit the Photo, here are some ways you can do so
Text Link
photo Link
<span class="text-link">
<span>
<a target="_blank" href=https://pikwizard.com/photo/financial-dashboard-displaying-candlestick-and-bar-charts-with-market-analytics-overlays/1688325a63a9df38e53919e726dccbec/>PikWizard</a>
</span>
</span>
<span class="image-link">
<span
style="margin: 0 0 20px 0; display: inline-block; vertical-align: middle; width: 100%;"
>
<a
target="_blank"
href="https://pikwizard.com/photo/financial-dashboard-displaying-candlestick-and-bar-charts-with-market-analytics-overlays/1688325a63a9df38e53919e726dccbec/"
style="text-decoration: none; font-size: 10px; margin: 0;"
>
<img src="https://pikwizard.com/pw/medium/1688325a63a9df38e53919e726dccbec.jpg" style="margin: 0; width: 100%;" alt="" />
<p style="font-size: 12px; margin: 0;">PikWizard</p>
</a>
</span>
</span>
Free (free of charge)
Free for personal and commercial use.
Author: Awesome Content
Similar Free Stock Images

Premium


Premium


Premium


Premium


Premium


Premium


Premium


Premium


Premium


Premium


Premium


Premium


Premium


Premium


Premium


Premium


Premium


Premium


Premium


Premium


Premium


Premium


Premium


Premium