
- Home >
- Stock Photos >
- Financial Dashboard with Bar Charts and Trend Lines
Financial Dashboard with Bar Charts and Trend Lines Image
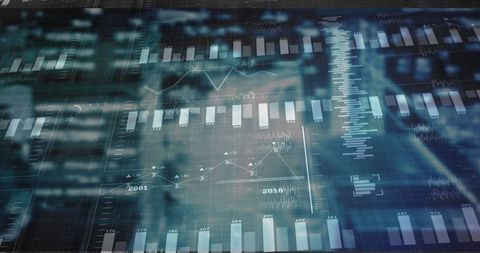
Appealing for illustrating concepts in finance, data analysis, and business management. Suitable for use as a visual resource in presentations, educational materials for explaining financial forecasts and business performance insights. Ideal for publications discussing stock markets, trading analytics, or digital financial tools.
Powered by 


0
downloads
downloads
Tags:
More
Credit Photo
If you would like to credit the Photo, here are some ways you can do so
Text Link
photo Link
<span class="text-link">
<span>
<a target="_blank" href=https://pikwizard.com/photo/financial-dashboard-with-bar-charts-and-trend-lines/7e37c804f27a9c8b48ef3e9589ddd2ac/>PikWizard</a>
</span>
</span>
<span class="image-link">
<span
style="margin: 0 0 20px 0; display: inline-block; vertical-align: middle; width: 100%;"
>
<a
target="_blank"
href="https://pikwizard.com/photo/financial-dashboard-with-bar-charts-and-trend-lines/7e37c804f27a9c8b48ef3e9589ddd2ac/"
style="text-decoration: none; font-size: 10px; margin: 0;"
>
<img src="https://pikwizard.com/pw/medium/7e37c804f27a9c8b48ef3e9589ddd2ac.jpg" style="margin: 0; width: 100%;" alt="" />
<p style="font-size: 12px; margin: 0;">PikWizard</p>
</a>
</span>
</span>
Free (free of charge)
Free for personal and commercial use.
Author: People Creations