- Home >
- Stock Photos >
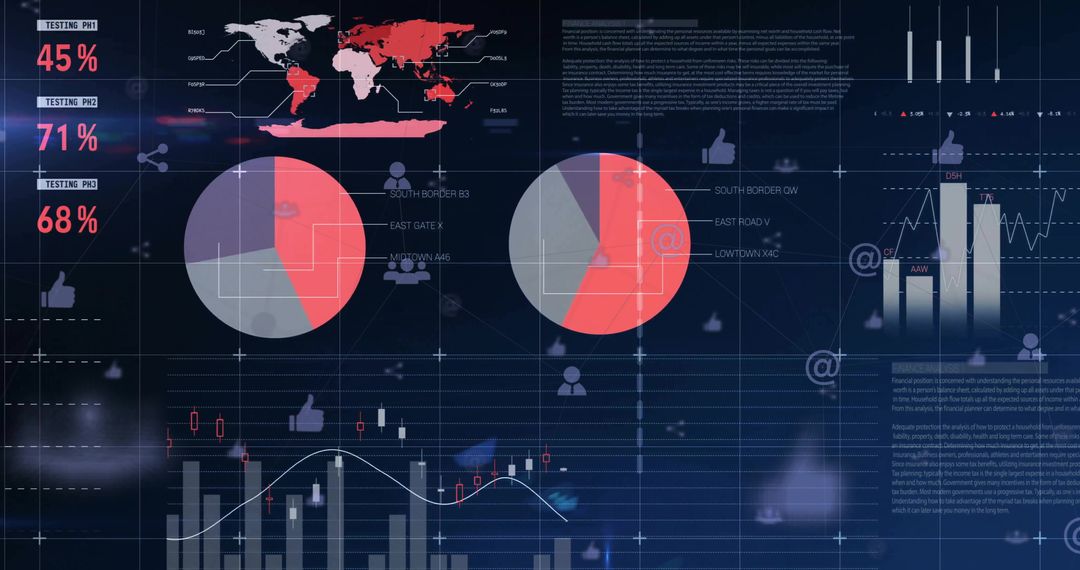
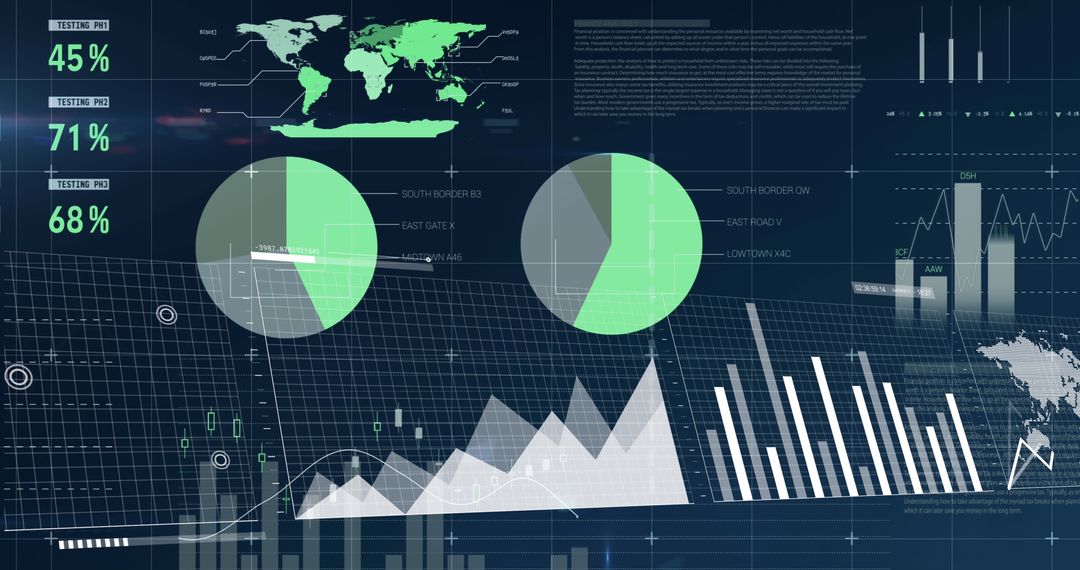
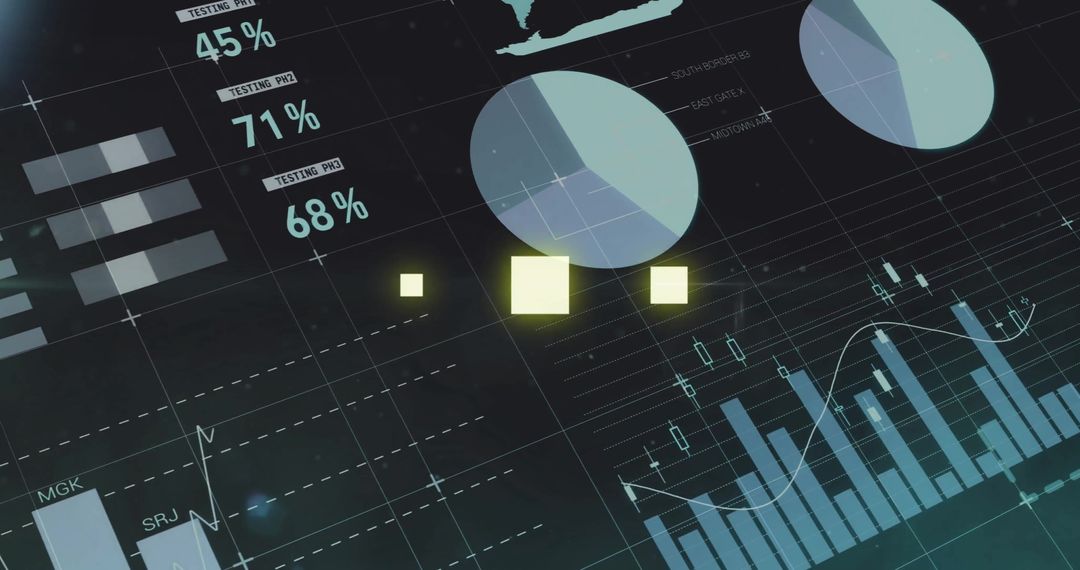
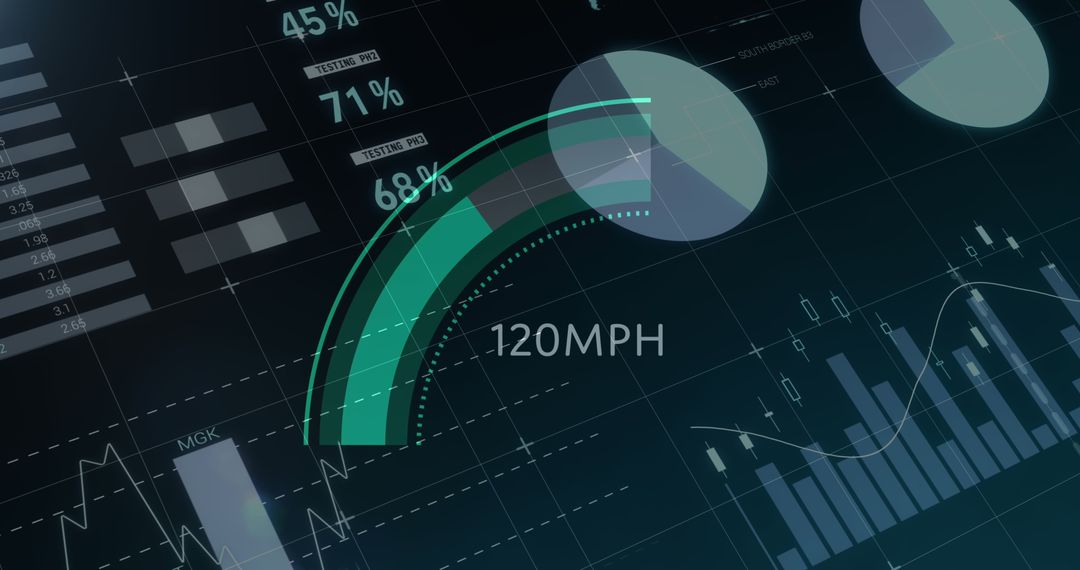
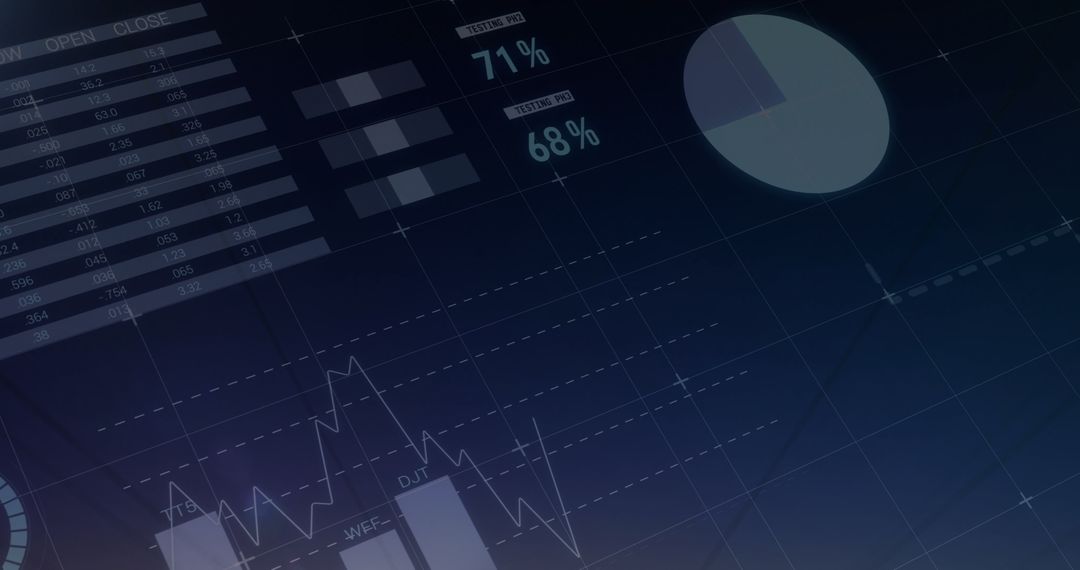
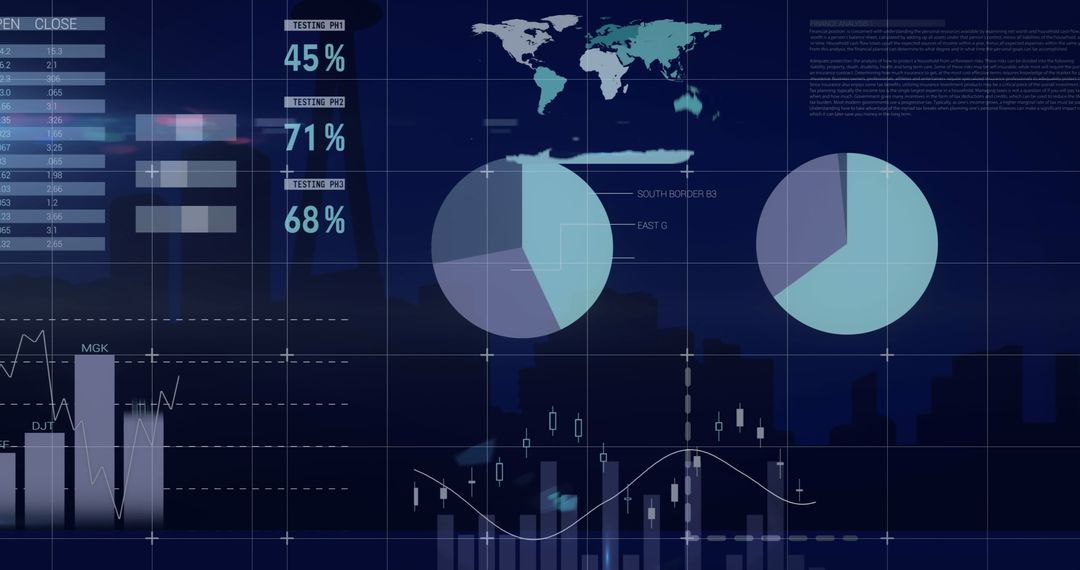
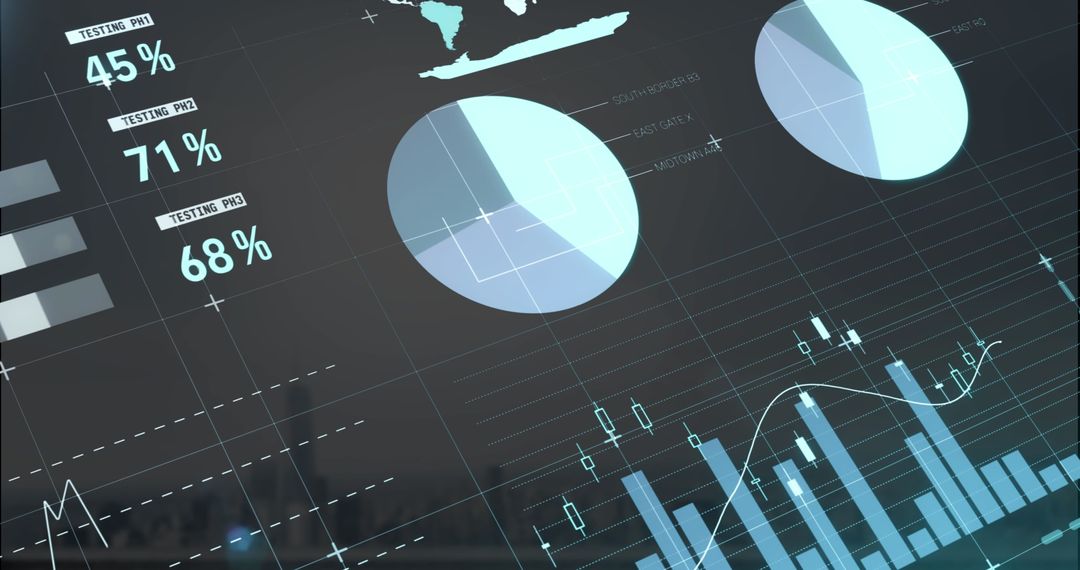
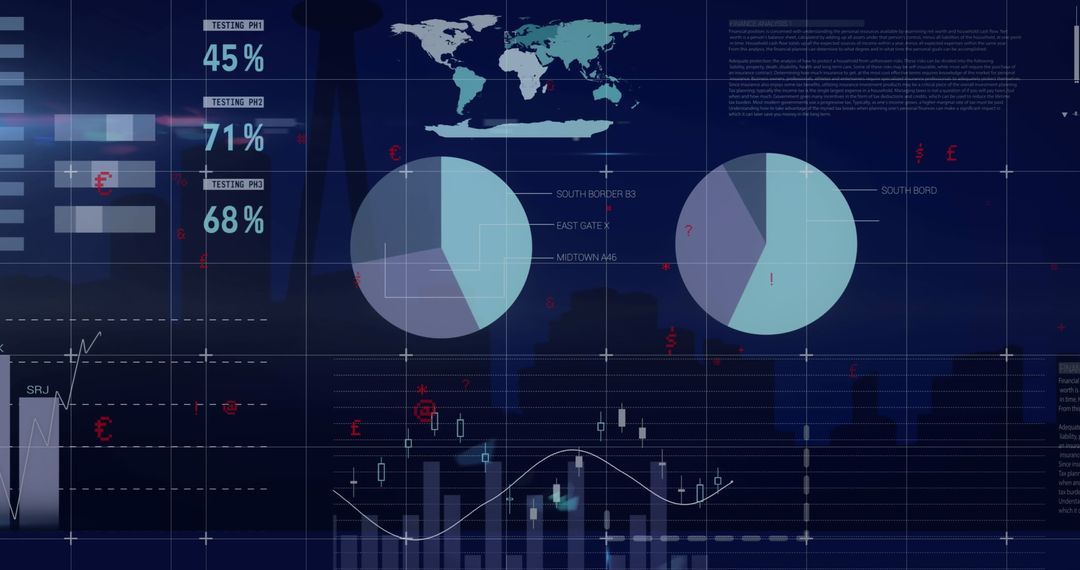
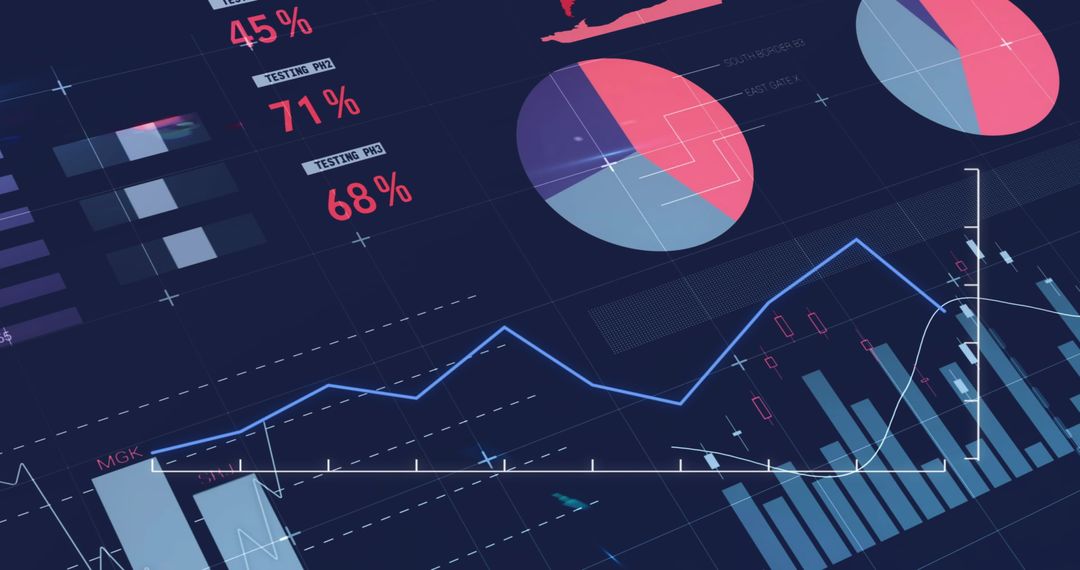
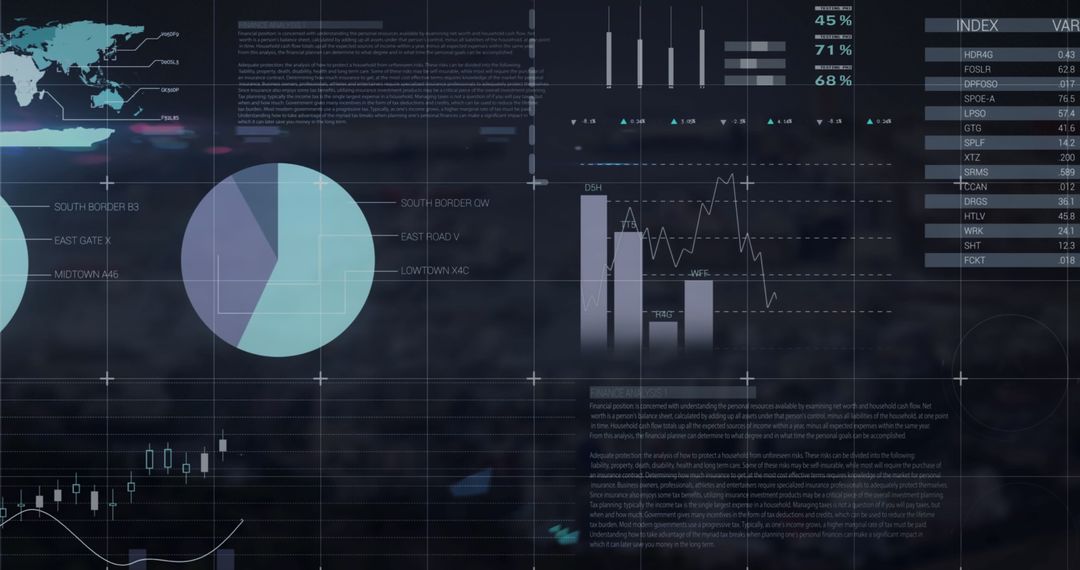
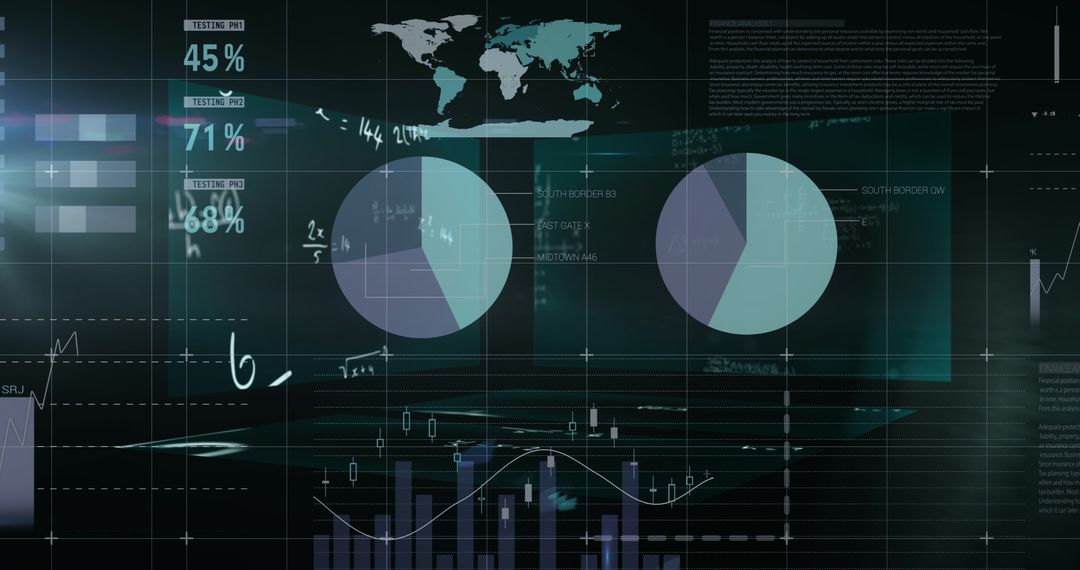
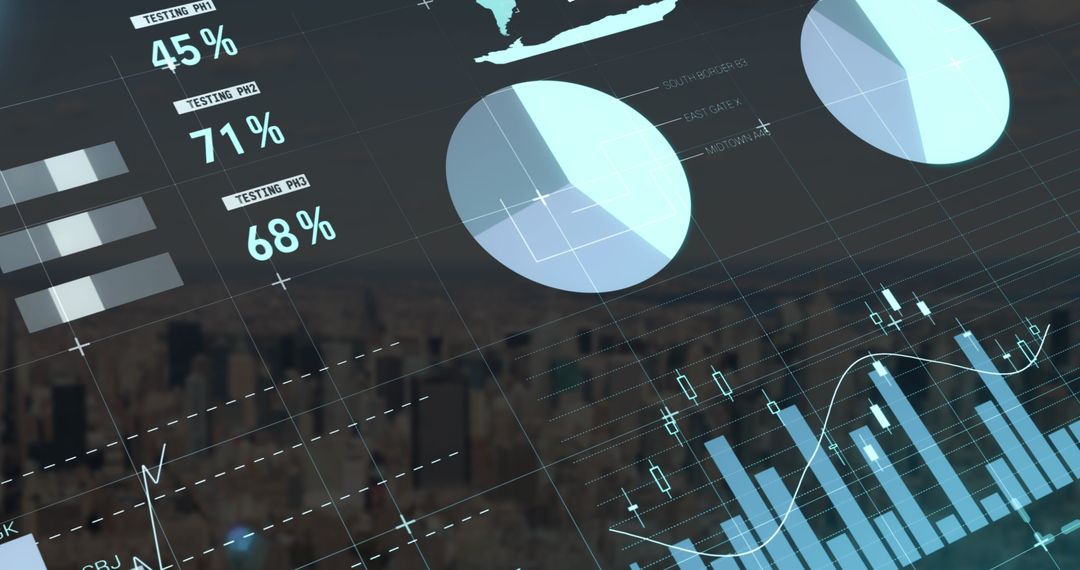
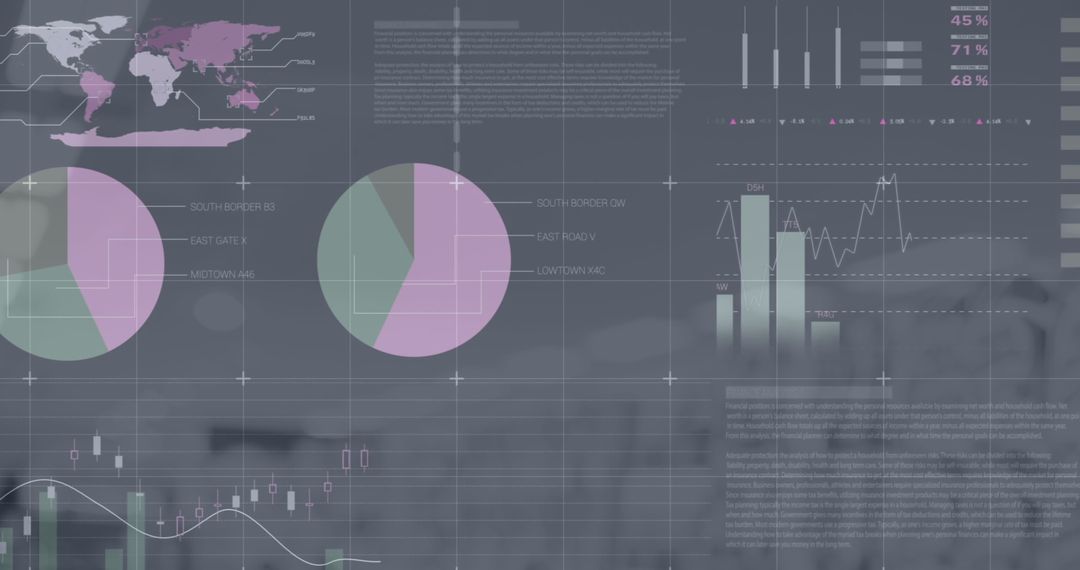
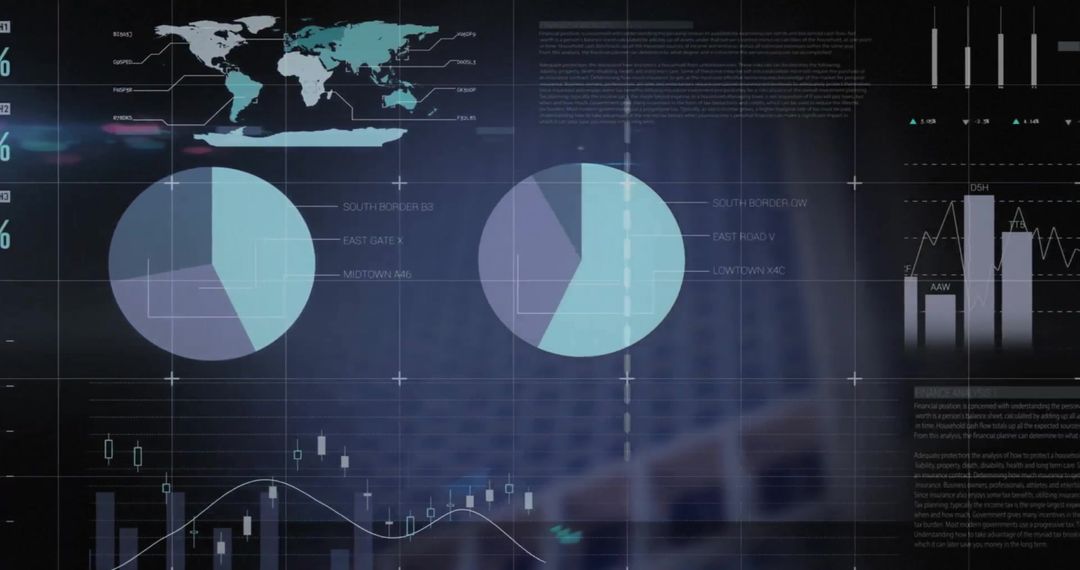
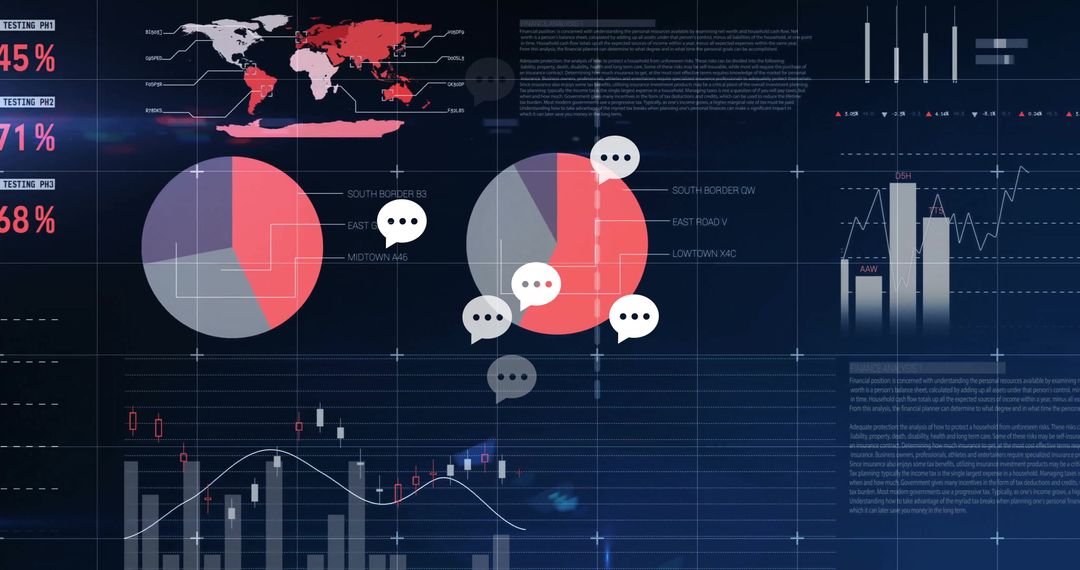
- Financial Dashboard with Candlestick and Pie Charts for Investment Data Analysis
Financial Dashboard with Candlestick and Pie Charts for Investment Data Analysis Image

This visual representation showcases a dynamic financial dashboard featuring various data analytics elements like candlestick charts and pie charts representing medical and real estate sectors. Ideal for presentations, reports, and educational materials related to financial technology, investment strategies, or creating economic projections. It can be used by finance professionals, analysts, and educators to illustrate trends and connections between different data metrics in industries like healthcare and real estate.
Powered by  - Get 15% off with code: PIKWIZARD15


2
downloads
downloads
Tags:
More
Credit Photo
If you would like to credit the Photo, here are some ways you can do so
Text Link
photo Link
<span class="text-link">
<span>
<a target="_blank" href=https://pikwizard.com/photo/financial-dashboard-with-candlestick-and-pie-charts-for-investment-data-analysis/7e2e3001fc86d849fb2fa0de257bcb3e/>PikWizard</a>
</span>
</span>
<span class="image-link">
<span
style="margin: 0 0 20px 0; display: inline-block; vertical-align: middle; width: 100%;"
>
<a
target="_blank"
href="https://pikwizard.com/photo/financial-dashboard-with-candlestick-and-pie-charts-for-investment-data-analysis/7e2e3001fc86d849fb2fa0de257bcb3e/"
style="text-decoration: none; font-size: 10px; margin: 0;"
>
<img src="https://pikwizard.com/pw/medium/7e2e3001fc86d849fb2fa0de257bcb3e.jpg" style="margin: 0; width: 100%;" alt="" />
<p style="font-size: 12px; margin: 0;">PikWizard</p>
</a>
</span>
</span>
Free (free of charge)
Free for personal and commercial use.
Author: People Creations
Similar Free Stock Images

Premium


Premium


Premium

Premium


Premium


Premium


Premium


Premium


Premium


Premium


Premium


Premium


Premium


Premium

Premium


Premium


Premium


Premium


Premium


Premium


Premium


Premium


Premium


Premium