- Home >
- Stock Photos >
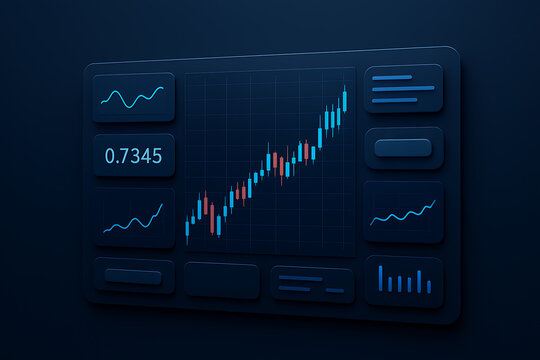
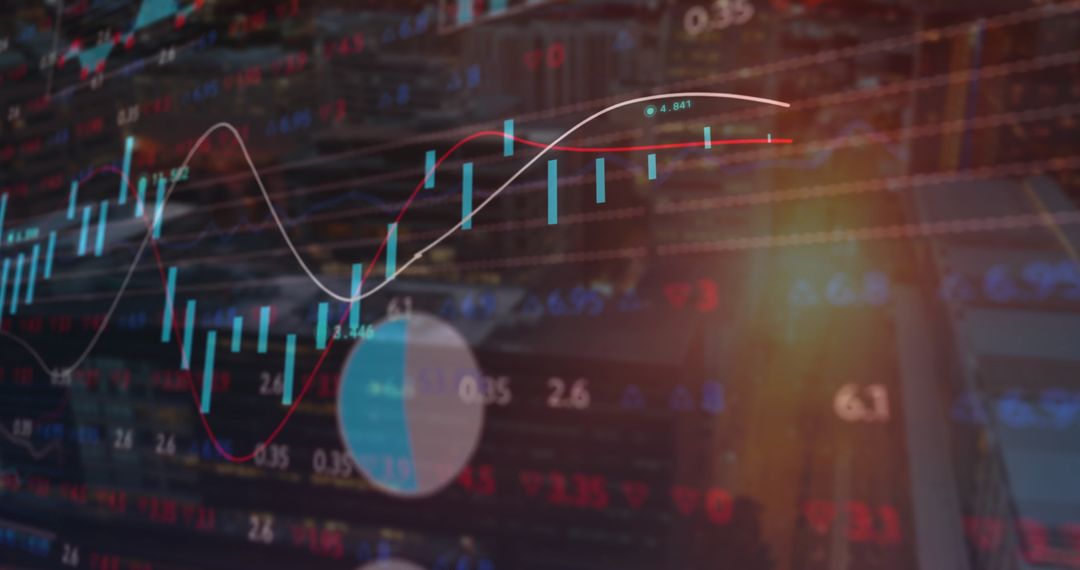
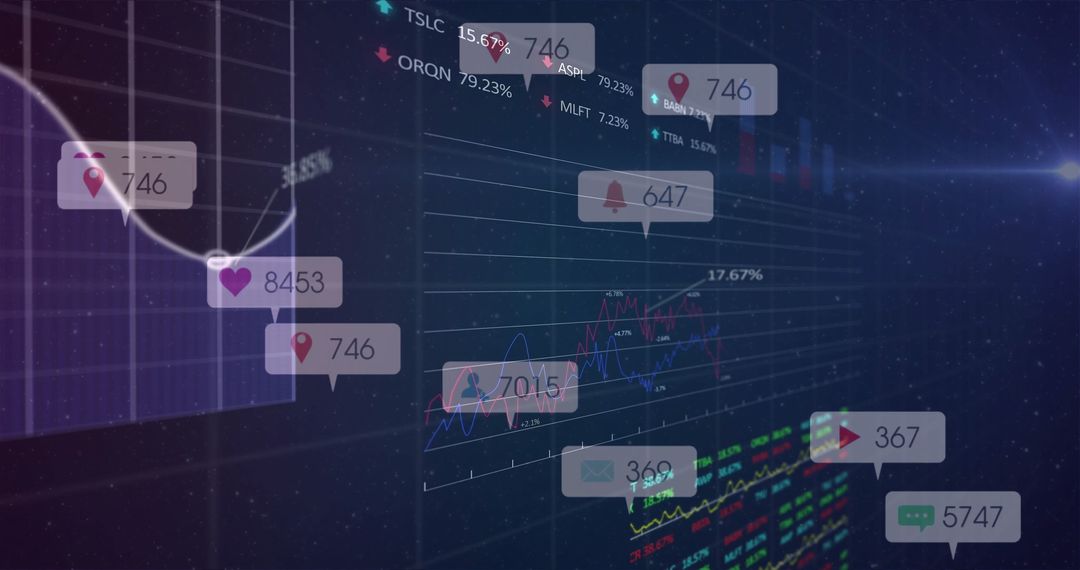
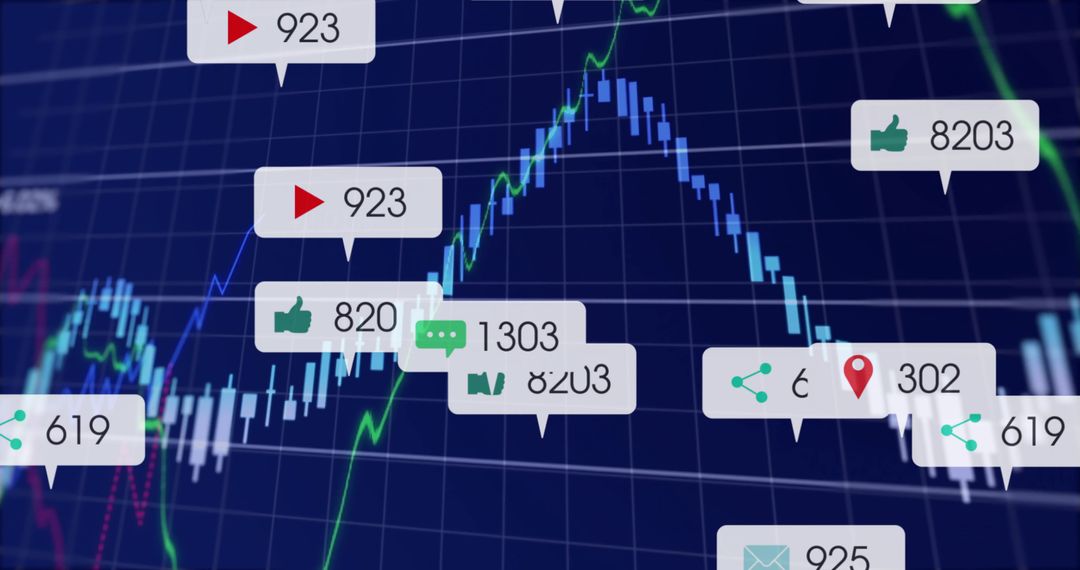
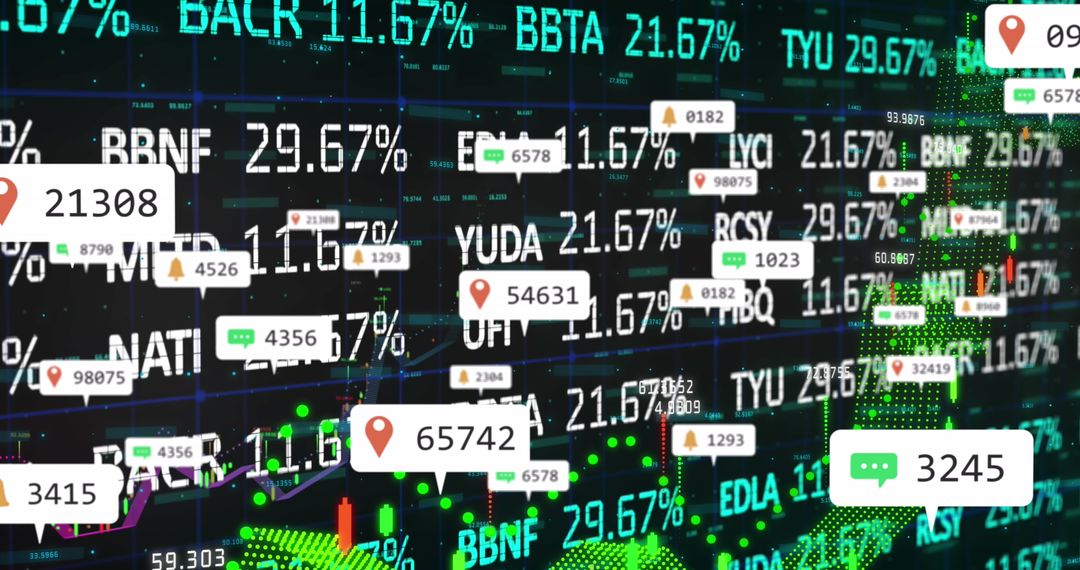
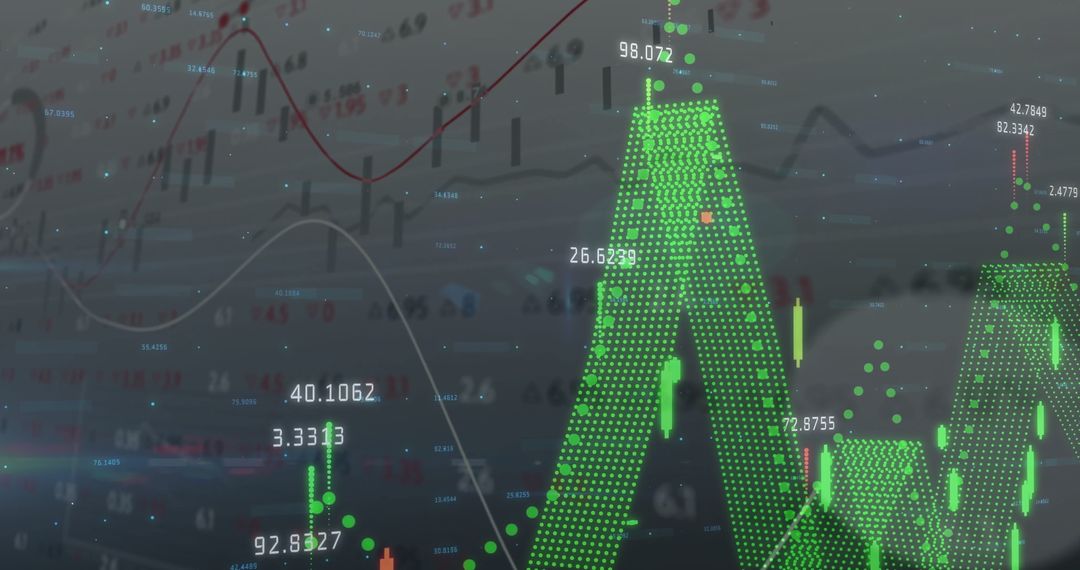
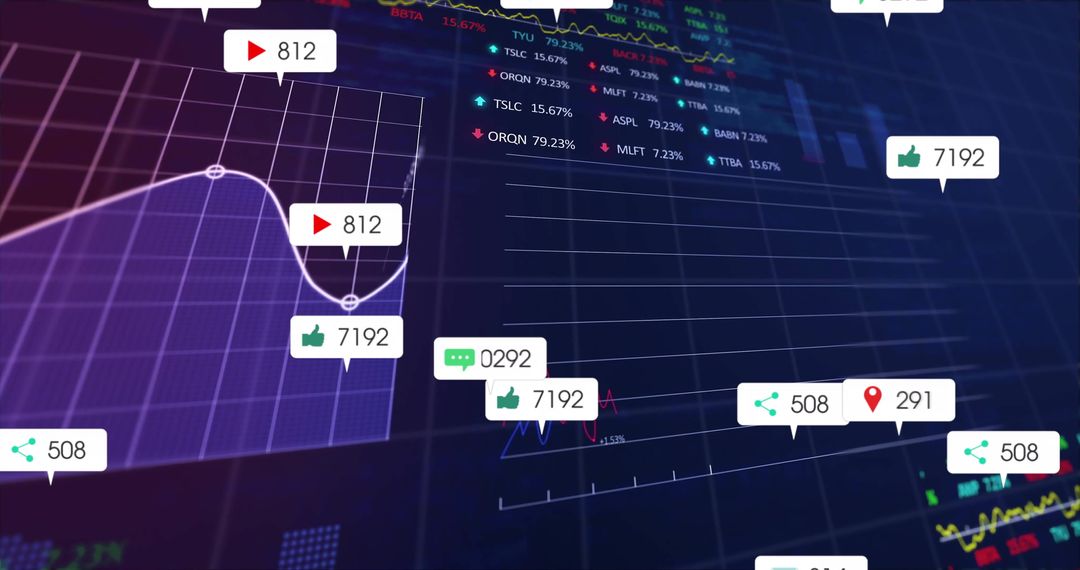
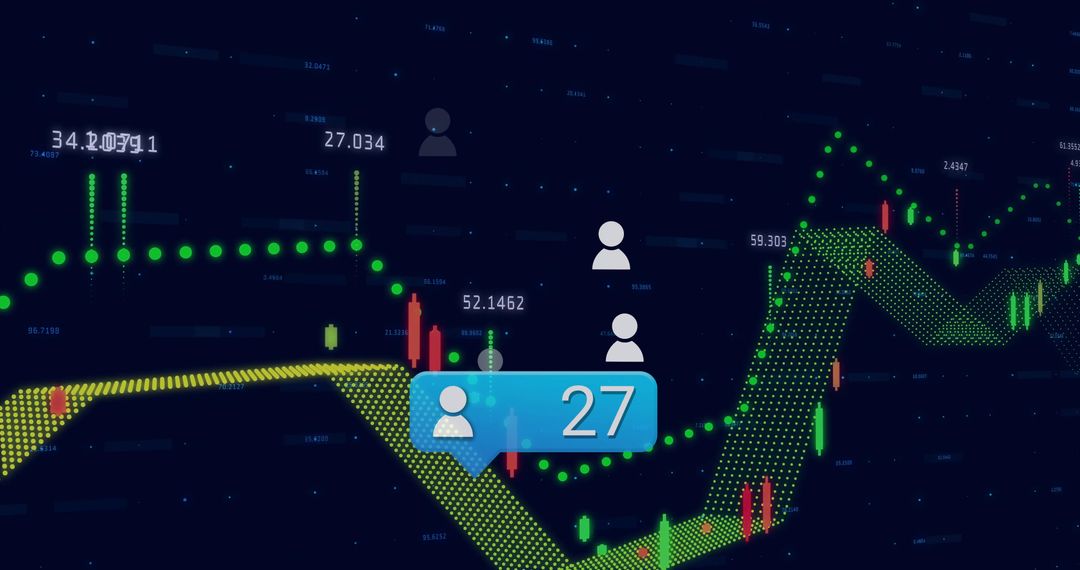
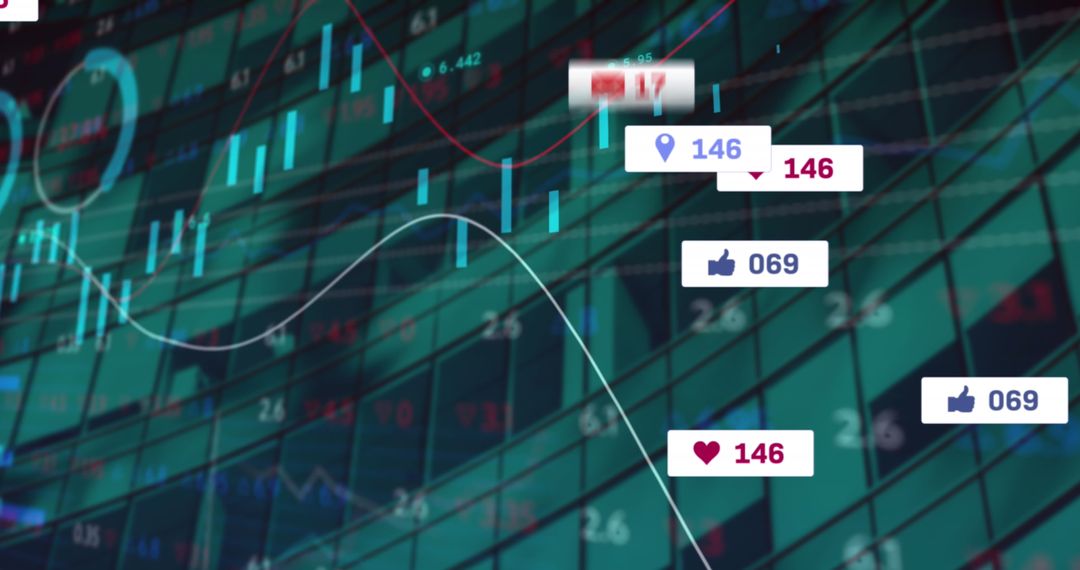
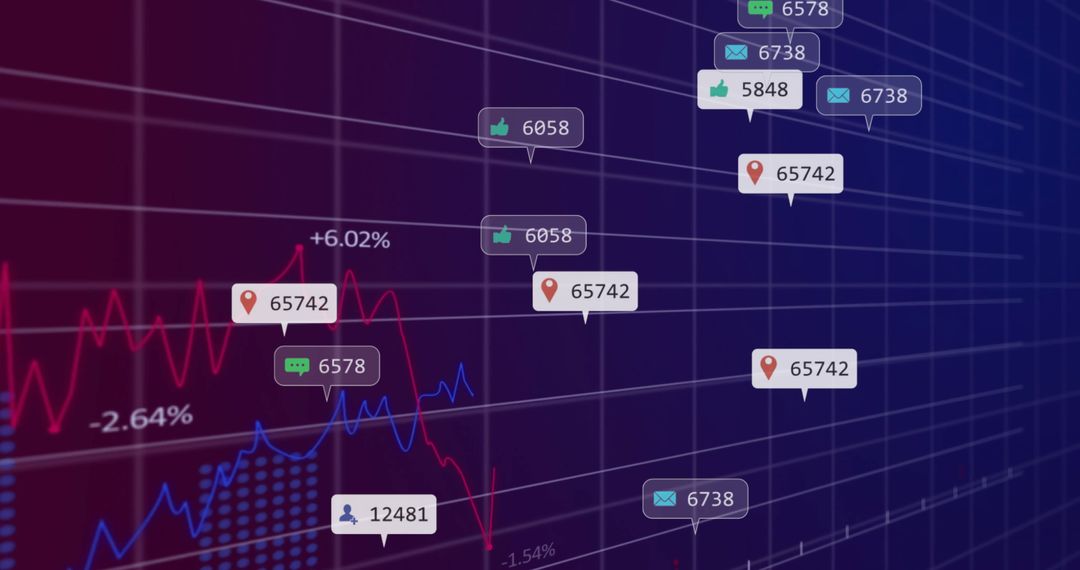
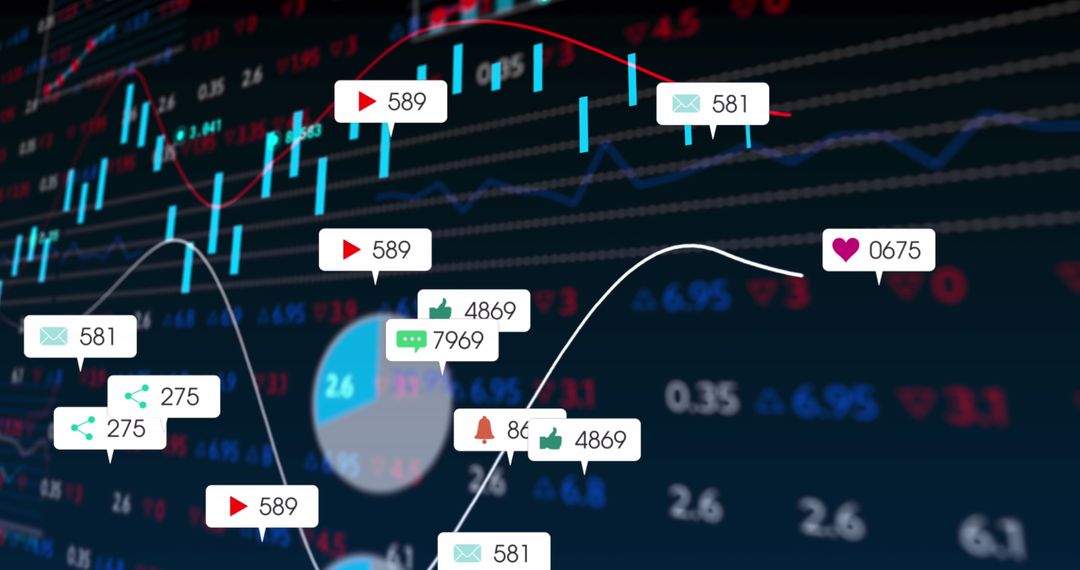
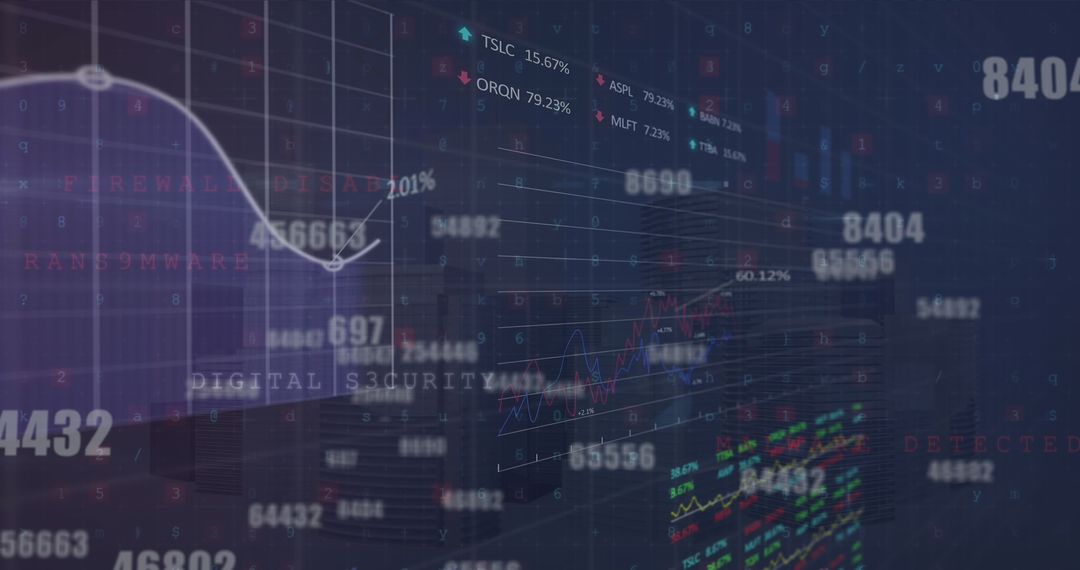
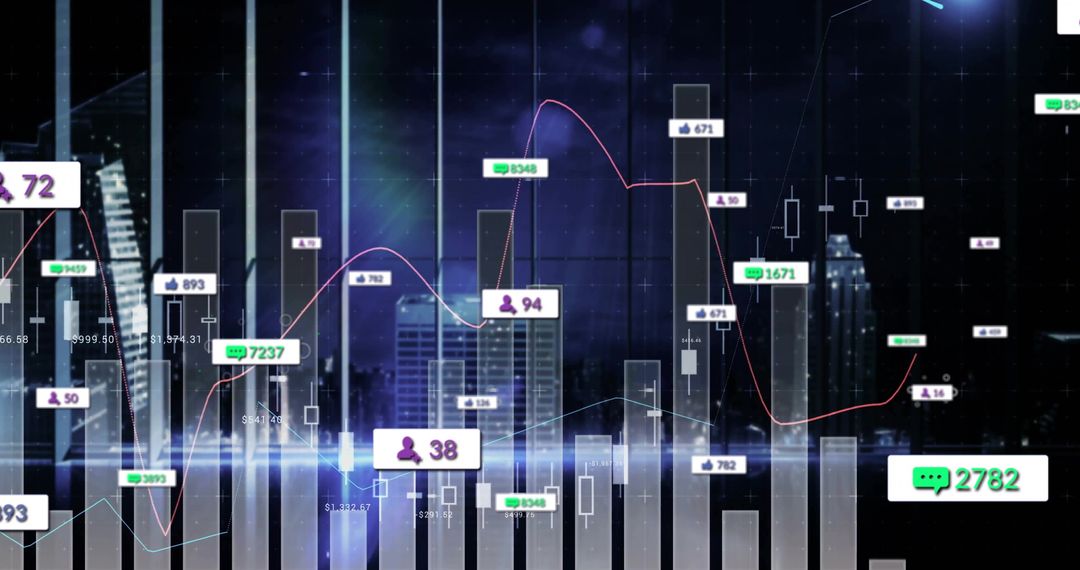
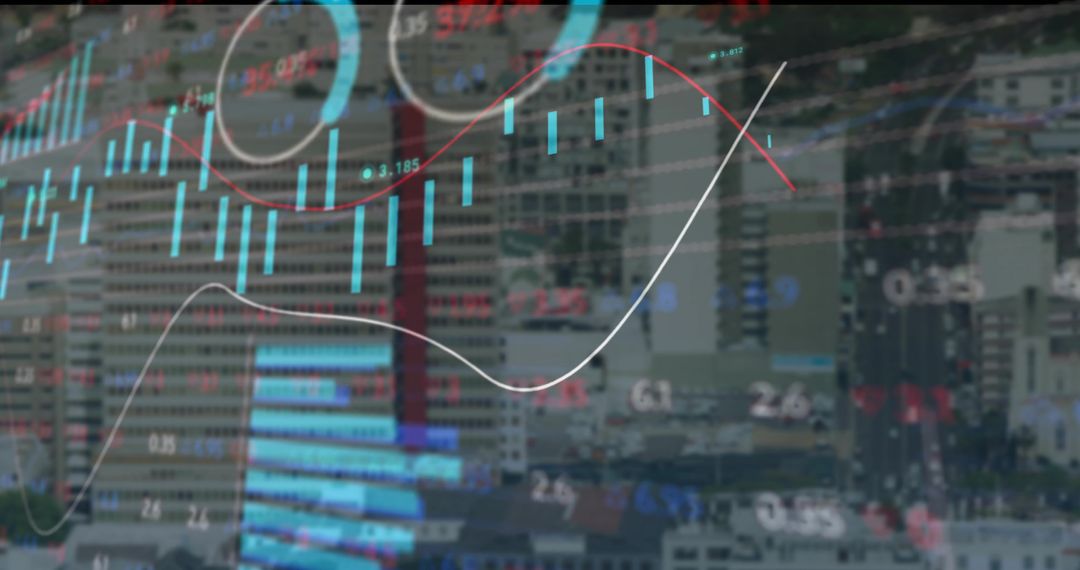
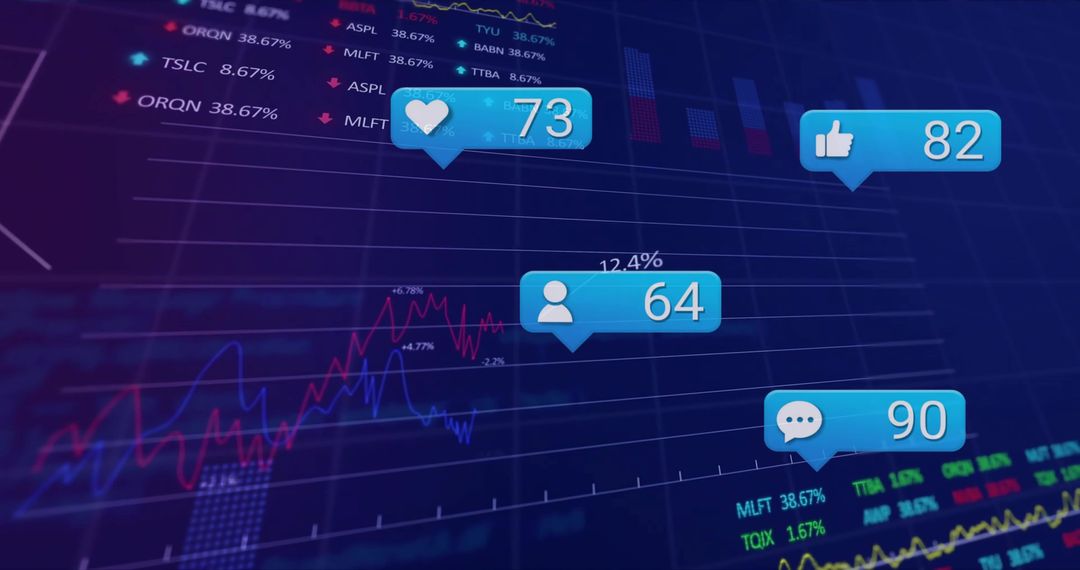
- Financial Dashboard with Candlestick Chart and Notifications
Financial Dashboard with Candlestick Chart and Notifications Image
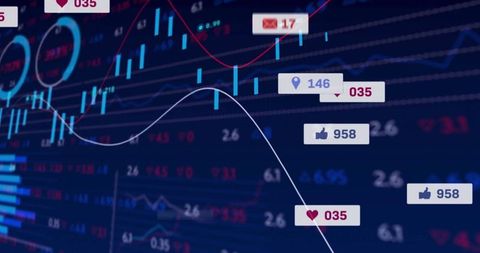
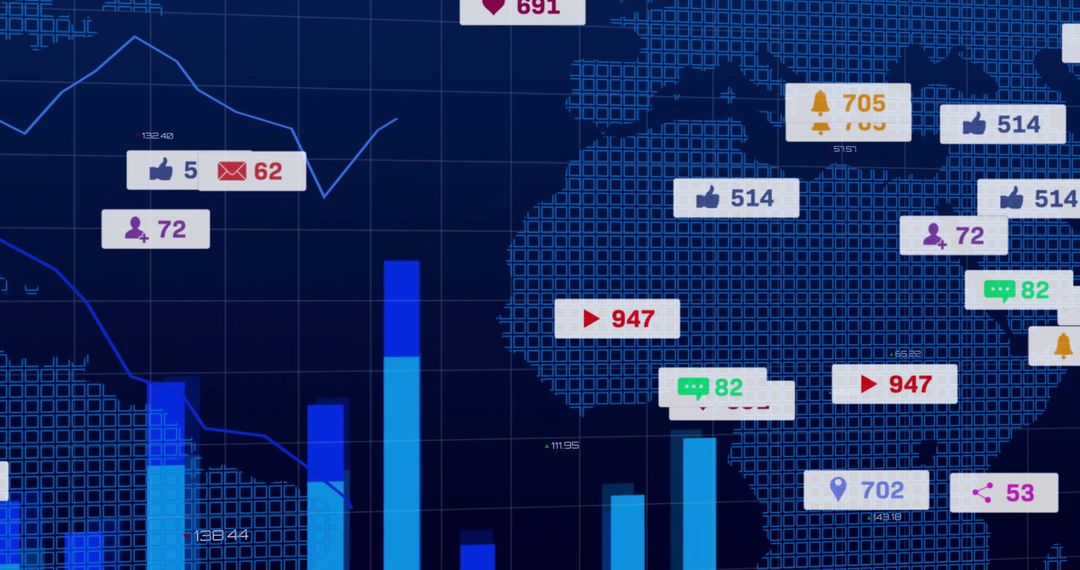
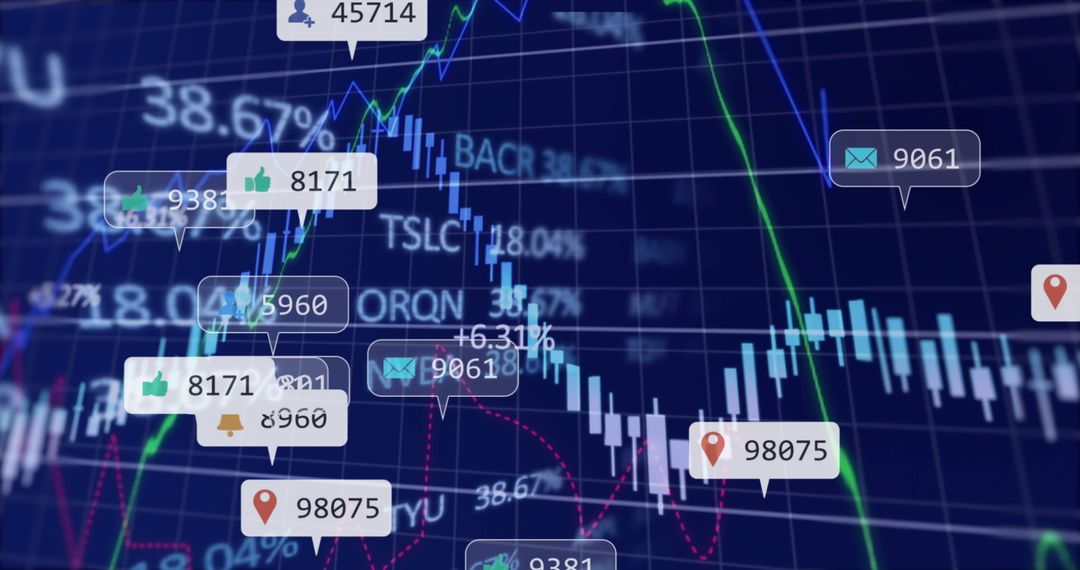
The depiction of a candlestick chart with overlaid notification symbols illustrates a modern digital finance dashboard. Informative aspect of this visualization makes it suitable for concepts related to market analysis, financial trends, and tech-driven investment methods. Ideal for use in presentations focusing on fintech innovations, business forecasts, or stock trading player applications.
Powered by 


0
downloads
downloads
Tags:
More
Credit Photo
If you would like to credit the Photo, here are some ways you can do so
Text Link
photo Link
<span class="text-link">
<span>
<a target="_blank" href=https://pikwizard.com/photo/financial-dashboard-with-candlestick-chart-and-notifications/96459a20861331f7e574e5714545fe67/>PikWizard</a>
</span>
</span>
<span class="image-link">
<span
style="margin: 0 0 20px 0; display: inline-block; vertical-align: middle; width: 100%;"
>
<a
target="_blank"
href="https://pikwizard.com/photo/financial-dashboard-with-candlestick-chart-and-notifications/96459a20861331f7e574e5714545fe67/"
style="text-decoration: none; font-size: 10px; margin: 0;"
>
<img src="https://pikwizard.com/pw/medium/96459a20861331f7e574e5714545fe67.jpg" style="margin: 0; width: 100%;" alt="" />
<p style="font-size: 12px; margin: 0;">PikWizard</p>
</a>
</span>
</span>
Free (free of charge)
Free for personal and commercial use.
Author: Awesome Content
Similar Free Stock Images

Premium


Premium


Premium


Premium


Premium


Premium


Premium


Premium


Premium


Premium

Premium


Premium


Premium


Premium


Premium


Premium


Premium

Premium


Premium


Premium


Premium


Premium

Premium


Premium