- Home >
- Stock Photos >
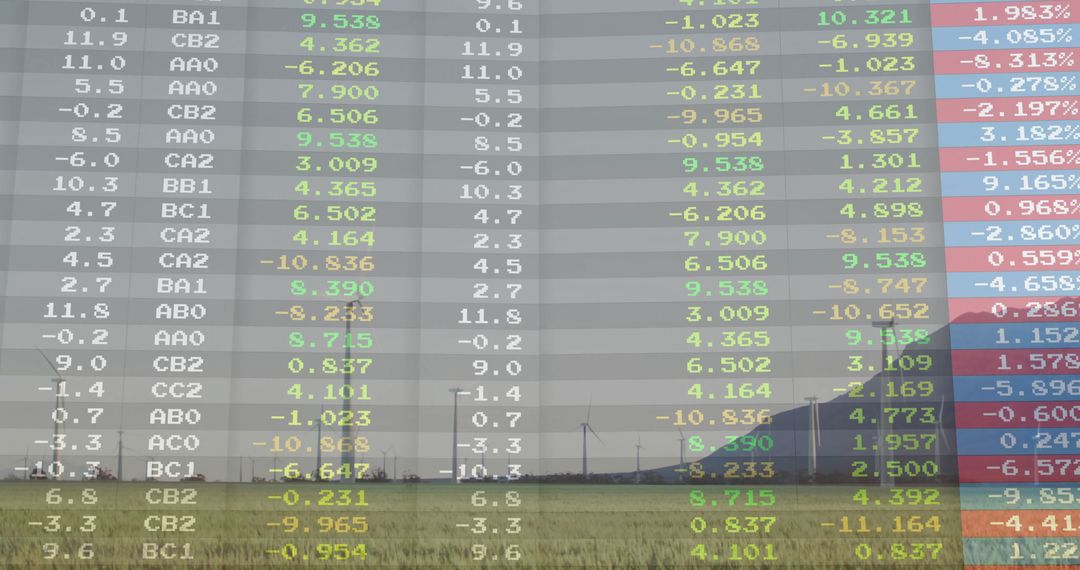
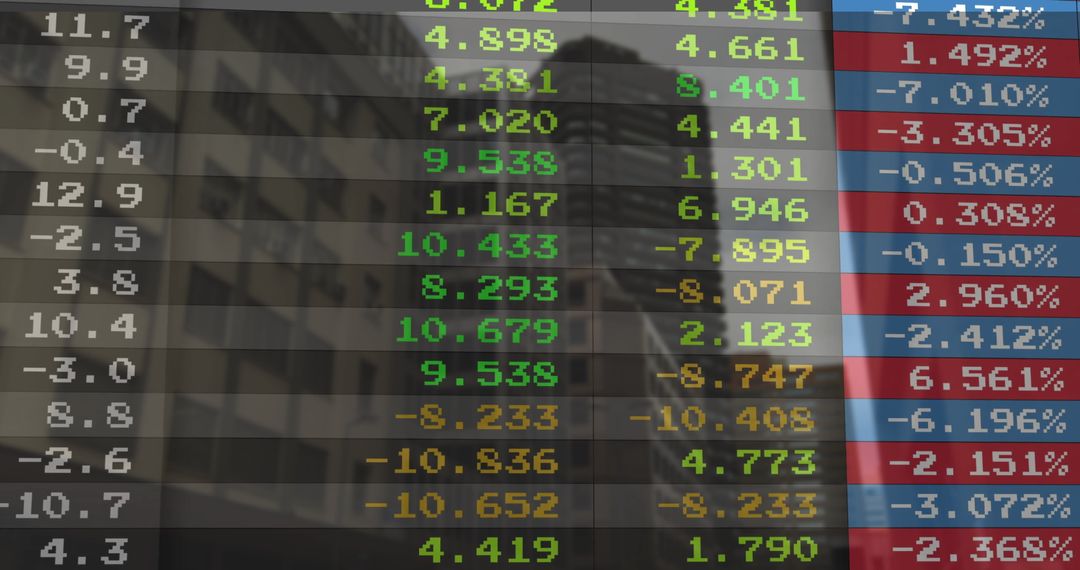
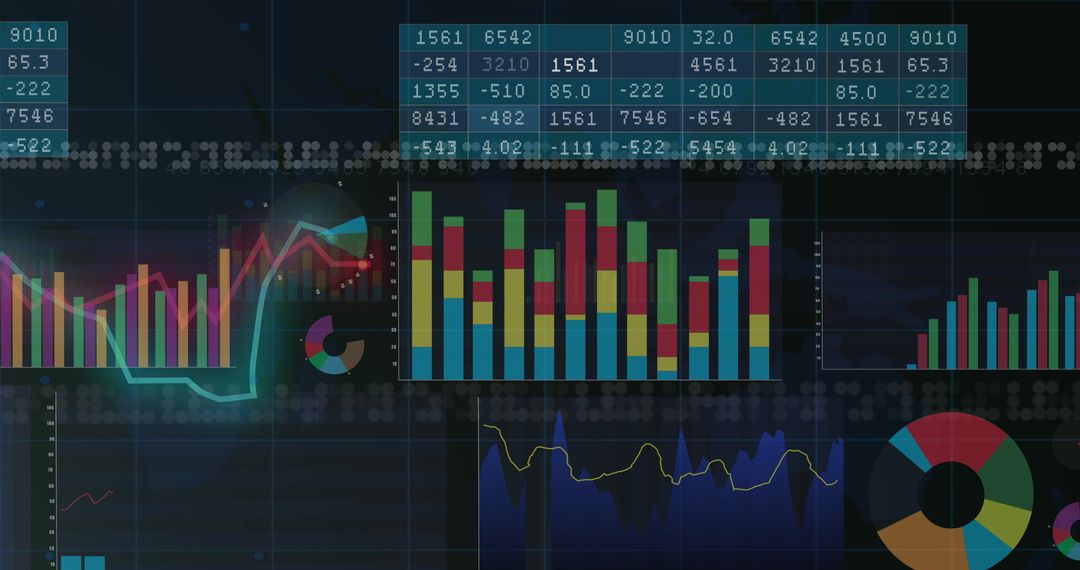
- Financial Dashboard with Charts and Data Grids
Financial Dashboard with Charts and Data Grids Image

This abstract composition depicts a financial dashboard on a trading platform showing colorful line graphs, bar charts, and a numerical grid. It is useful with topics about stock market analysis, investment strategies, and financial data visualization for reports, presentations, and educational materials.
Powered by 


0
downloads
downloads
Tags:
More
Credit Photo
If you would like to credit the Photo, here are some ways you can do so
Text Link
photo Link
<span class="text-link">
<span>
<a target="_blank" href=https://pikwizard.com/photo/financial-dashboard-with-charts-and-data-grids/8c056aa9571255a199cd160e7e018401/>PikWizard</a>
</span>
</span>
<span class="image-link">
<span
style="margin: 0 0 20px 0; display: inline-block; vertical-align: middle; width: 100%;"
>
<a
target="_blank"
href="https://pikwizard.com/photo/financial-dashboard-with-charts-and-data-grids/8c056aa9571255a199cd160e7e018401/"
style="text-decoration: none; font-size: 10px; margin: 0;"
>
<img src="https://pikwizard.com/pw/medium/8c056aa9571255a199cd160e7e018401.jpg" style="margin: 0; width: 100%;" alt="" />
<p style="font-size: 12px; margin: 0;">PikWizard</p>
</a>
</span>
</span>
Free (free of charge)
Free for personal and commercial use.
Author: Authentic Images
Similar Free Stock Images

Premium


Premium


Premium


Premium


Premium


Premium


Premium


Premium


Premium


Premium


Premium


Premium


Premium


Premium


Premium


Premium


Premium


Premium


Premium


Premium


Premium


Premium


Premium


Premium