- Home >
- Stock Photos >
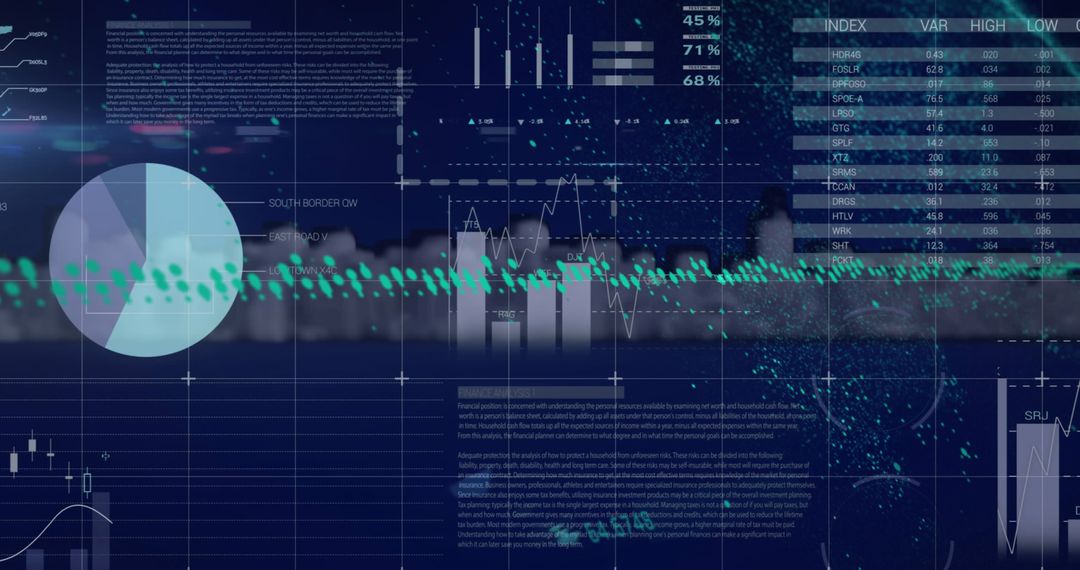
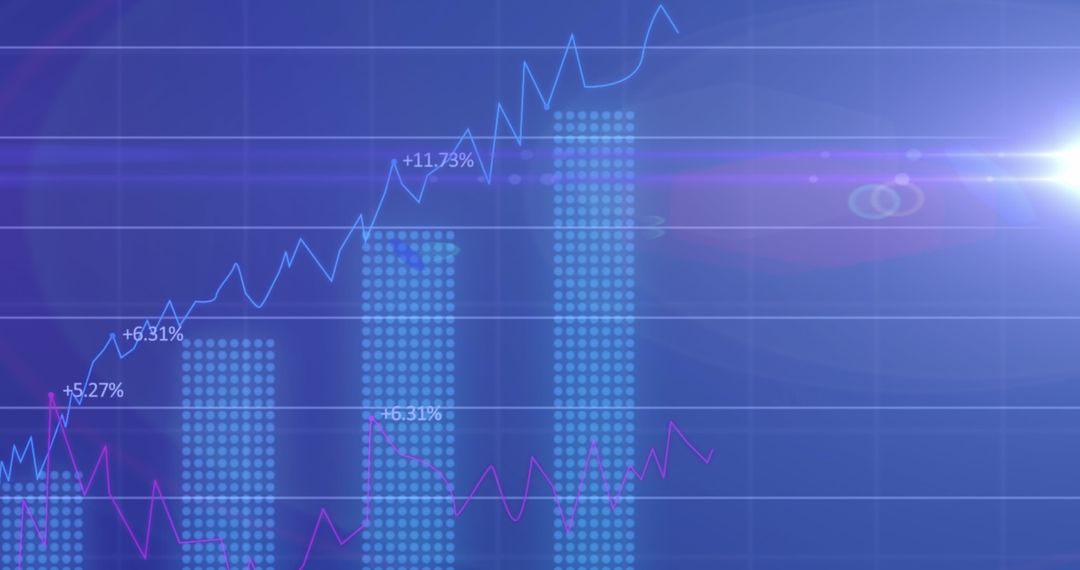
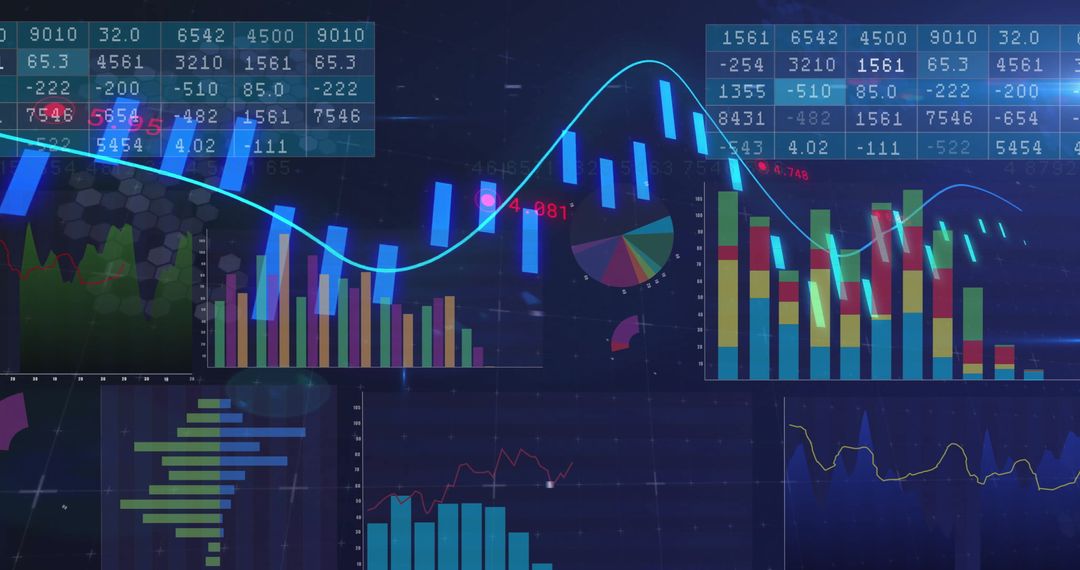
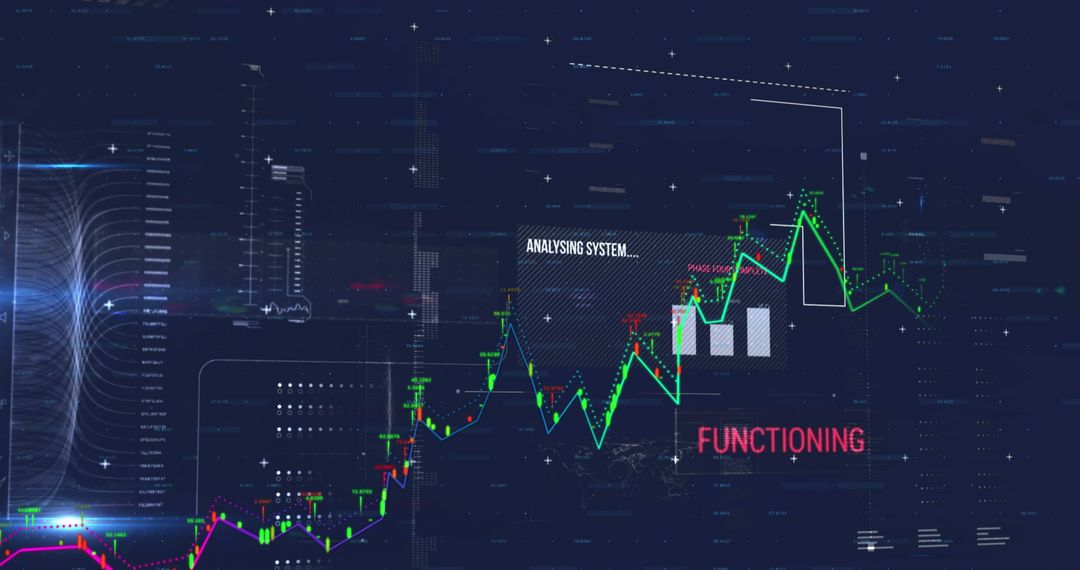
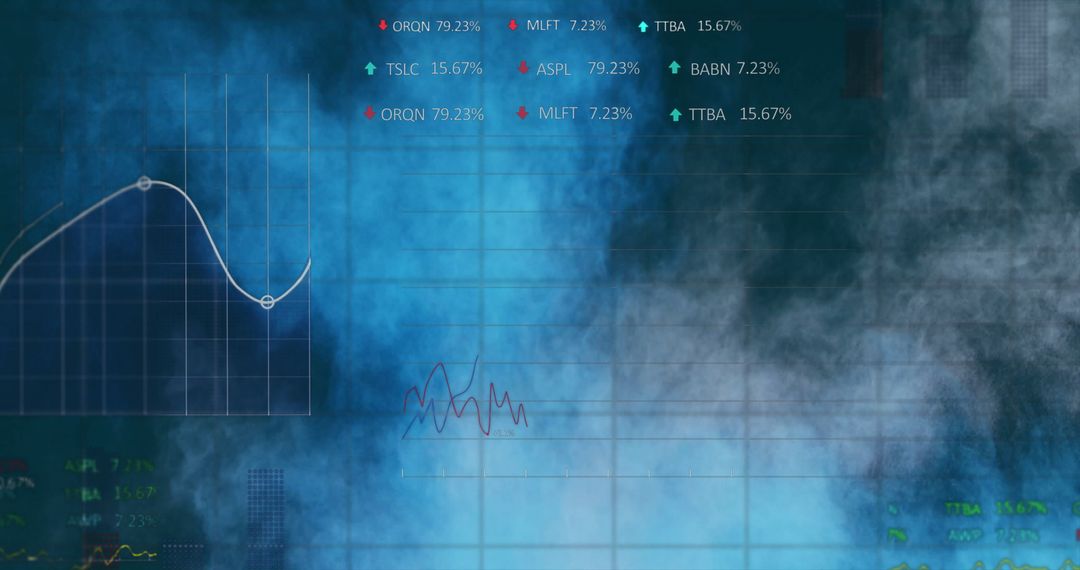
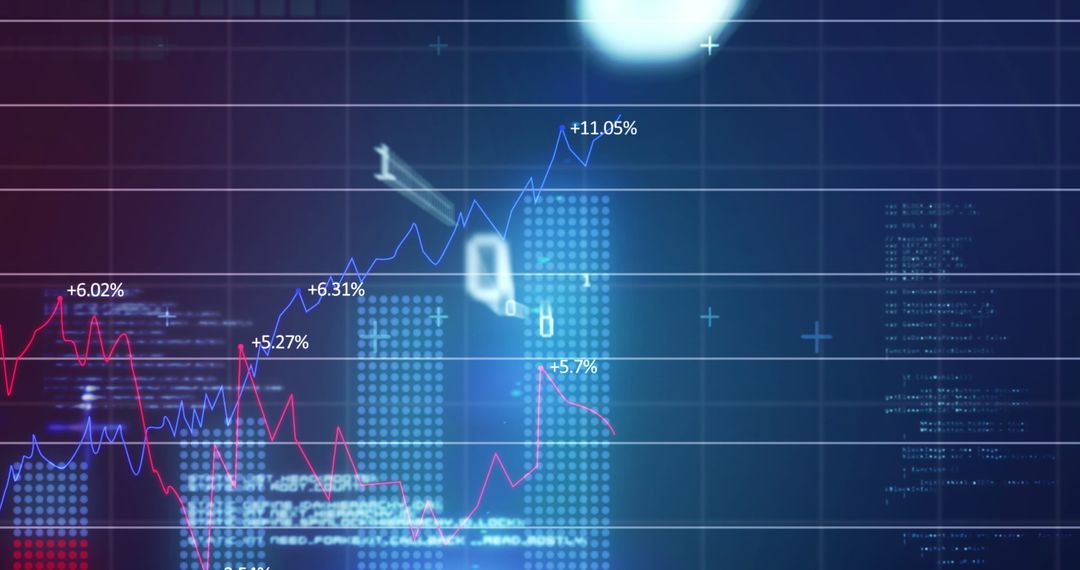
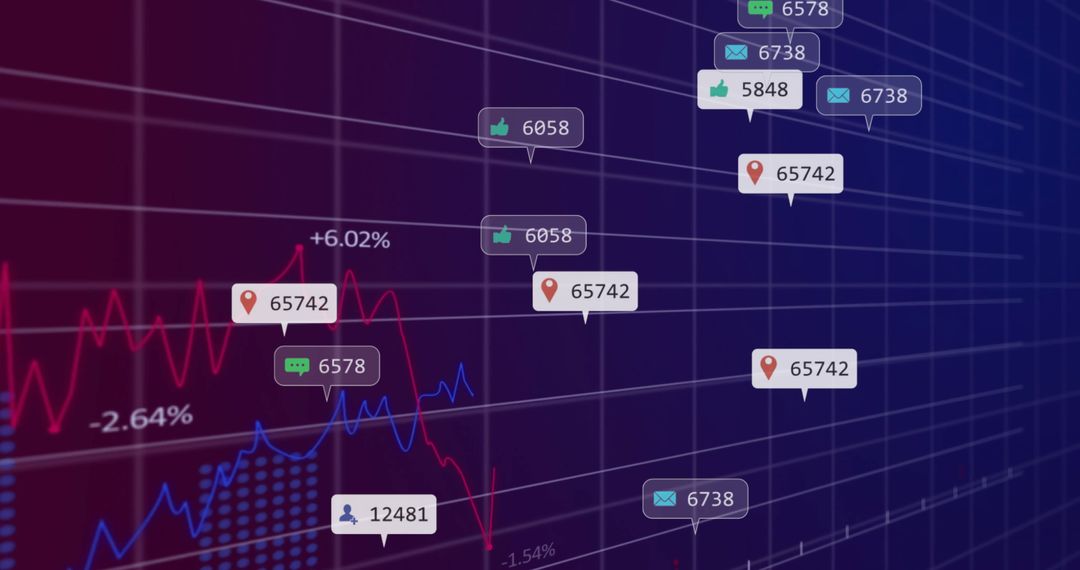
- Financial Dashboard with Line Graph and Bar Chart in Digital Interface
Financial Dashboard with Line Graph and Bar Chart in Digital Interface Image

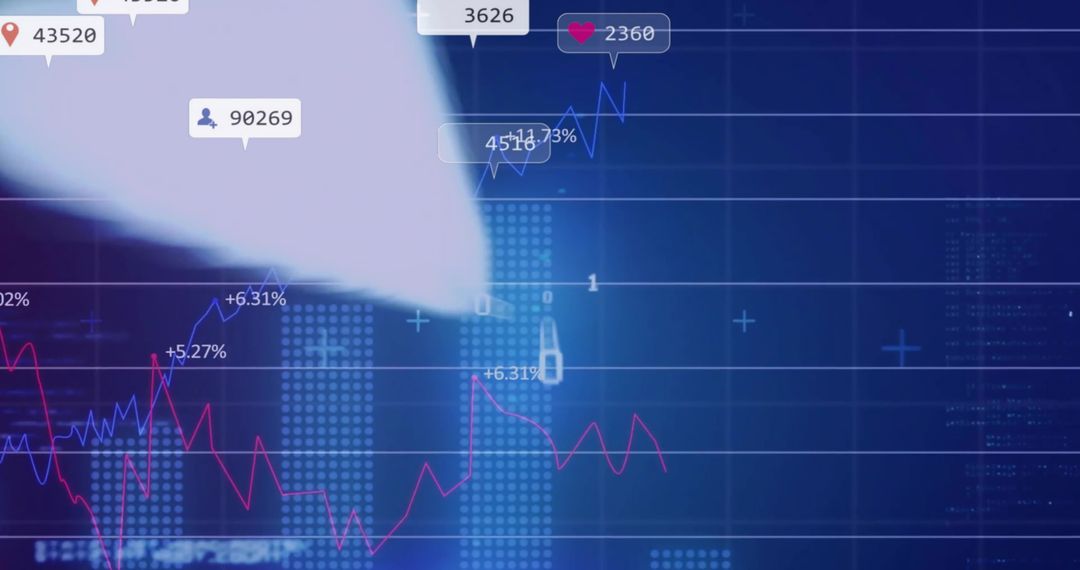
A screen featuring a digital financial dashboard with red line graph and blue bar chart, along with various notification icons. This is ideal for illustrating concepts related to technology, data analytics, finance, investment strategies, and modern business practices. Suitable for presentations, articles, and educational materials about financial technology and data analysis.
Powered by  - Get 15% off with code: PIKWIZARD15


0
downloads
downloads
Tags:
More
Credit Photo
If you would like to credit the Photo, here are some ways you can do so
Text Link
photo Link
<span class="text-link">
<span>
<a target="_blank" href=https://pikwizard.com/photo/financial-dashboard-with-line-graph-and-bar-chart-in-digital-interface/928e69ba8528658cef659a42e5dc12b7/>PikWizard</a>
</span>
</span>
<span class="image-link">
<span
style="margin: 0 0 20px 0; display: inline-block; vertical-align: middle; width: 100%;"
>
<a
target="_blank"
href="https://pikwizard.com/photo/financial-dashboard-with-line-graph-and-bar-chart-in-digital-interface/928e69ba8528658cef659a42e5dc12b7/"
style="text-decoration: none; font-size: 10px; margin: 0;"
>
<img src="https://pikwizard.com/pw/medium/928e69ba8528658cef659a42e5dc12b7.jpg" style="margin: 0; width: 100%;" alt="" />
<p style="font-size: 12px; margin: 0;">PikWizard</p>
</a>
</span>
</span>
Free (free of charge)
Free for personal and commercial use.
Author: Authentic Images
Similar Free Stock Images

Premium


Premium


Premium


Premium


Premium


Premium


Premium


Premium


Premium


Premium


Premium


Premium


Premium


Premium


Premium


Premium


Premium


Premium


Premium


Premium


Premium


Premium


Premium


Premium