- Home >
- Stock Photos >
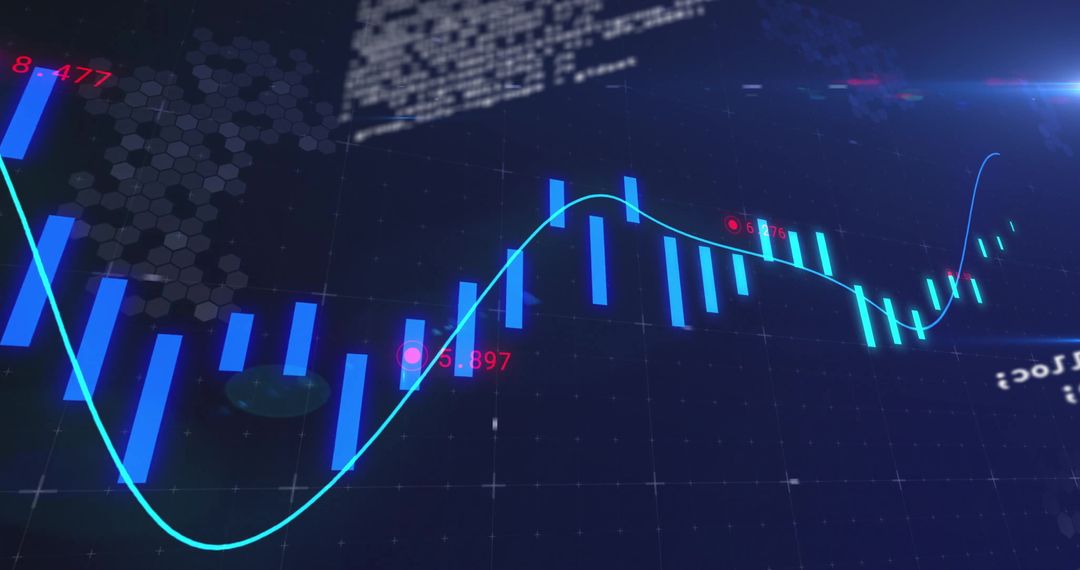
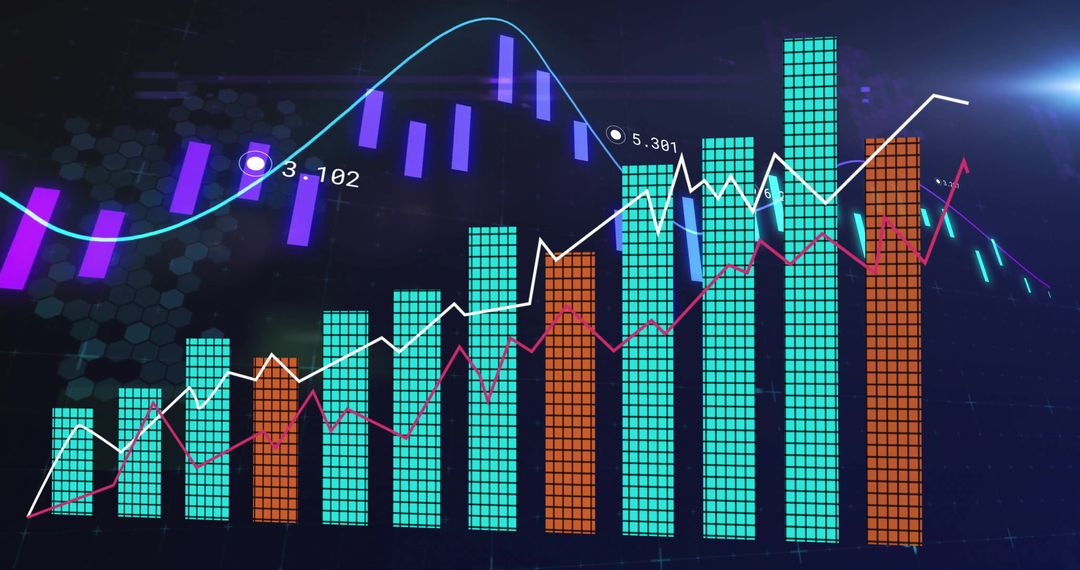
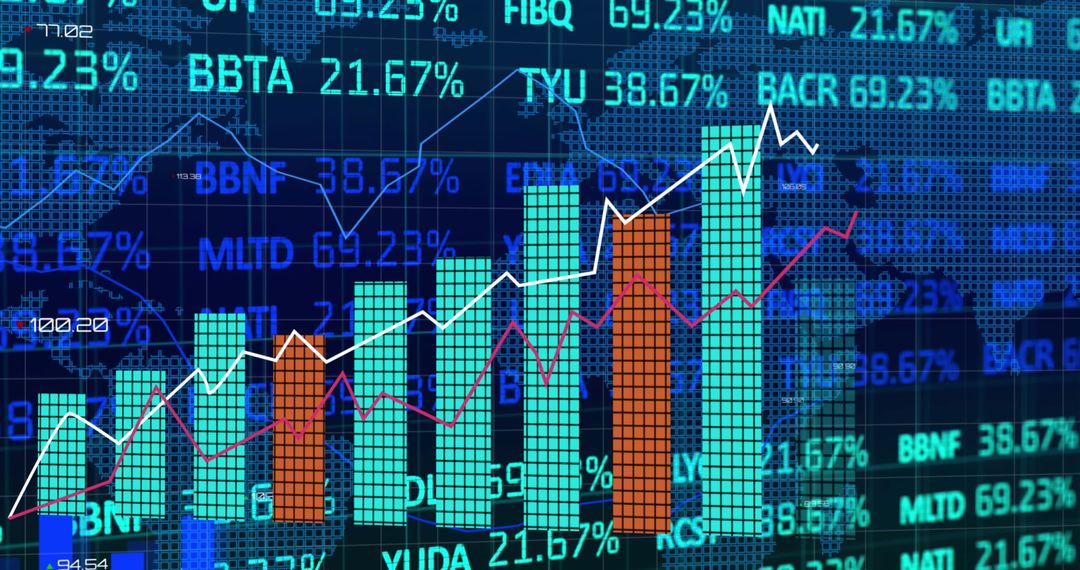
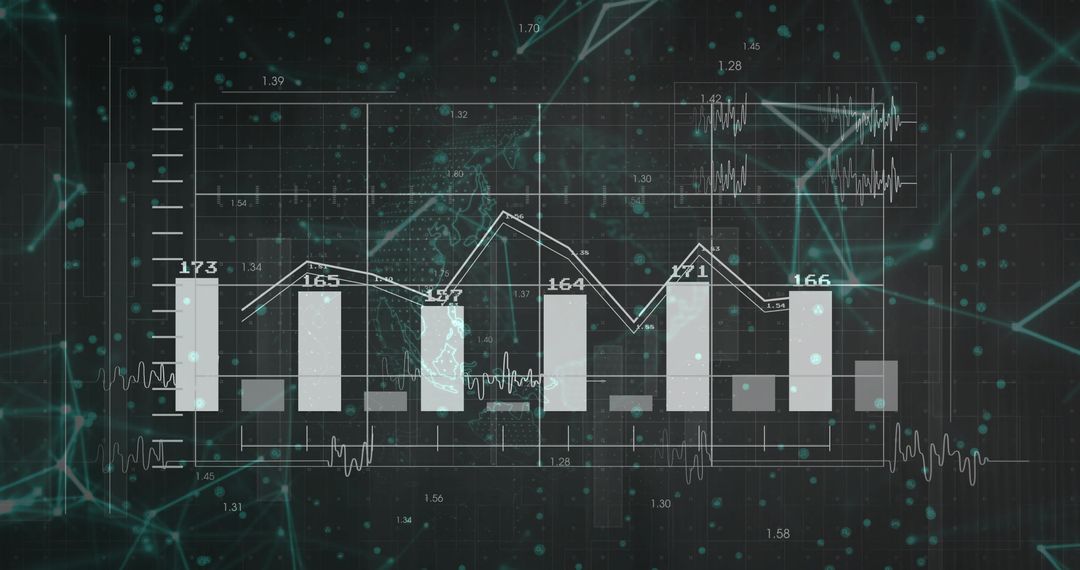
- Financial Dashboard with Rising Bar and Line Charts Visualization
Financial Dashboard with Rising Bar and Line Charts Visualization Image
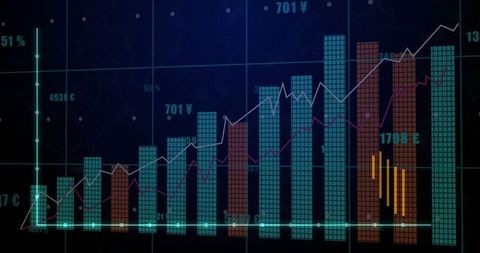
Displaying a digital finance interface with rising teal bar graphs and gold candlestick charts over grid lines, the graphic represents financial growth and market trends. Used for illustrating investment analytics, futuristic financial reports, or educational presentations about economic conditions. The advanced visual display is ideal for traders, financial analysts, or corporate presentations aiming at visual data influence and strategic market decisions.
Powered by 


0
downloads
downloads
Tags:
More
Credit Photo
If you would like to credit the Photo, here are some ways you can do so
Text Link
photo Link
<span class="text-link">
<span>
<a target="_blank" href=https://pikwizard.com/photo/financial-dashboard-with-rising-bar-and-line-charts-visualization/e30d070436b4d445f49aa9a41b37f09a/>PikWizard</a>
</span>
</span>
<span class="image-link">
<span
style="margin: 0 0 20px 0; display: inline-block; vertical-align: middle; width: 100%;"
>
<a
target="_blank"
href="https://pikwizard.com/photo/financial-dashboard-with-rising-bar-and-line-charts-visualization/e30d070436b4d445f49aa9a41b37f09a/"
style="text-decoration: none; font-size: 10px; margin: 0;"
>
<img src="https://pikwizard.com/pw/medium/e30d070436b4d445f49aa9a41b37f09a.jpg" style="margin: 0; width: 100%;" alt="" />
<p style="font-size: 12px; margin: 0;">PikWizard</p>
</a>
</span>
</span>
Free (free of charge)
Free for personal and commercial use.
Author: People Creations
Similar Free Stock Images

Premium


Premium


Premium


Premium


Premium


Premium


Premium


Premium


Premium


Premium


Premium


Premium


Premium


Premium


Premium


Premium


Premium


Premium


Premium


Premium


Premium


Premium


Premium


Premium