- Home >
- Stock Photos >
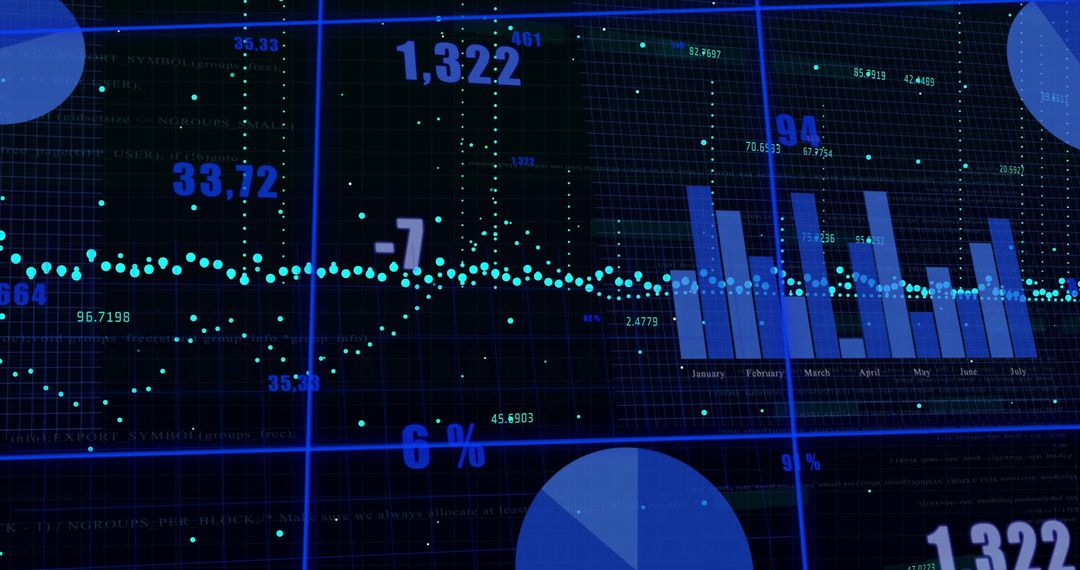
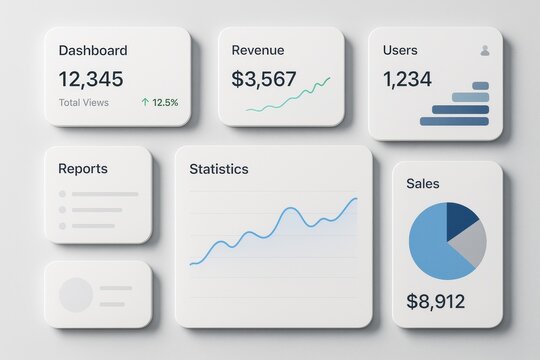
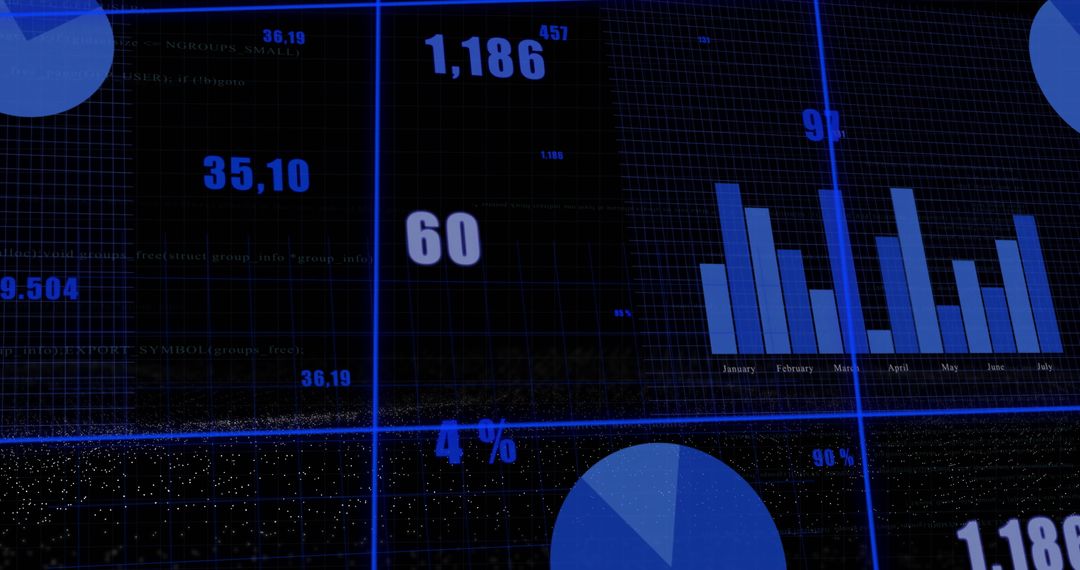
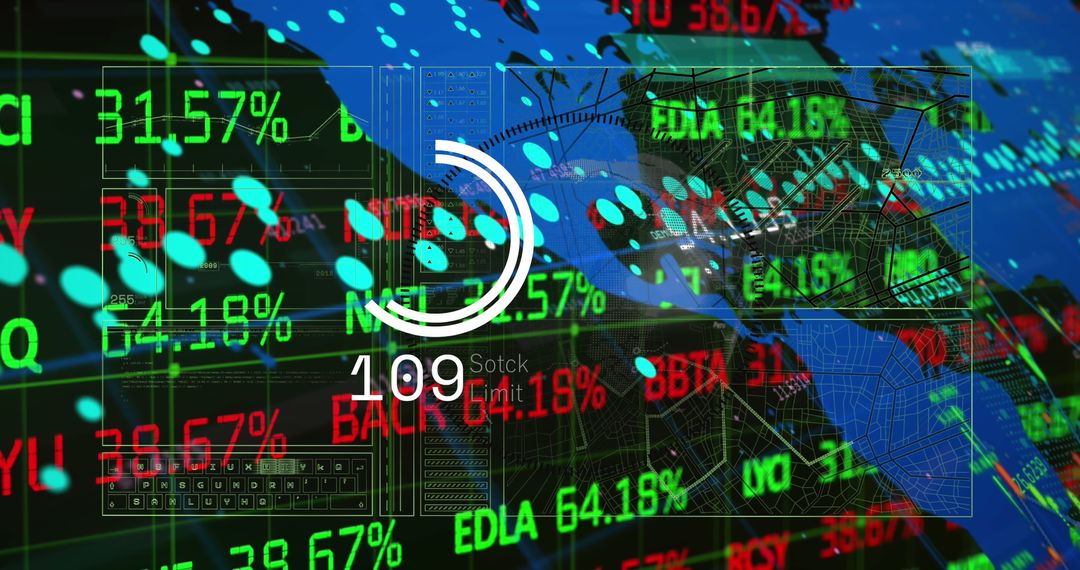
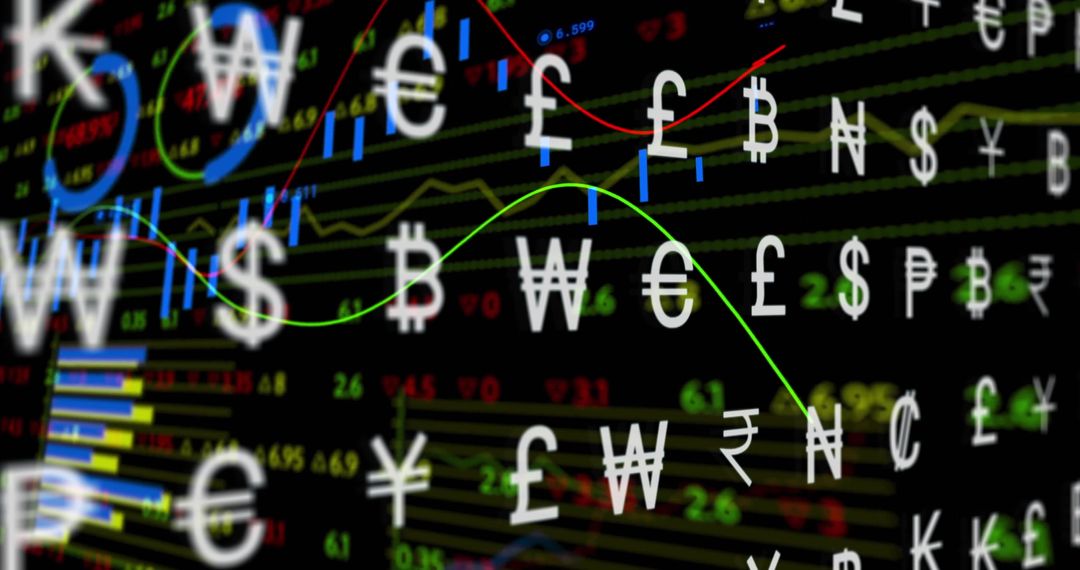
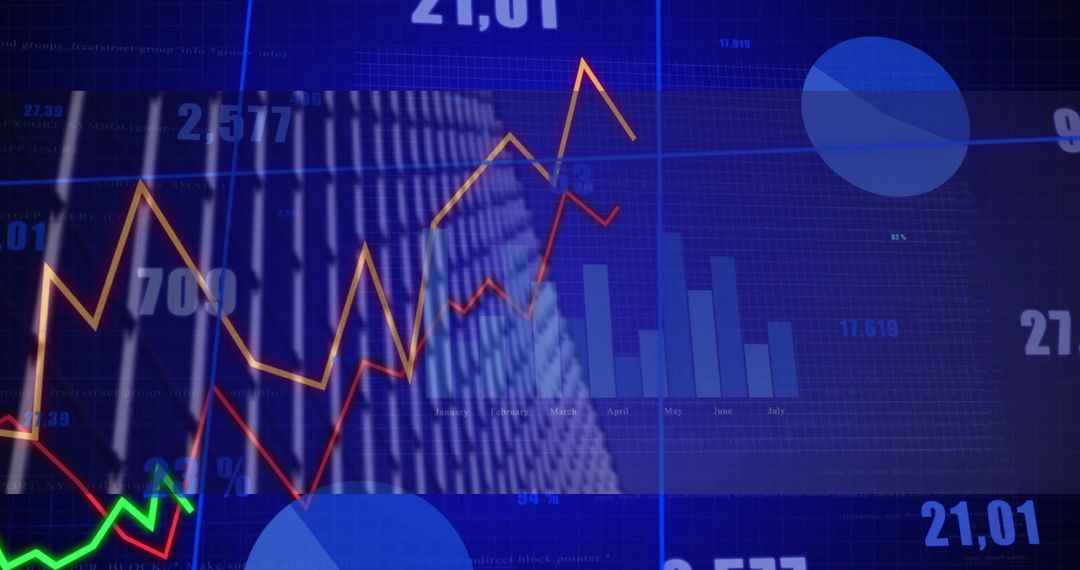
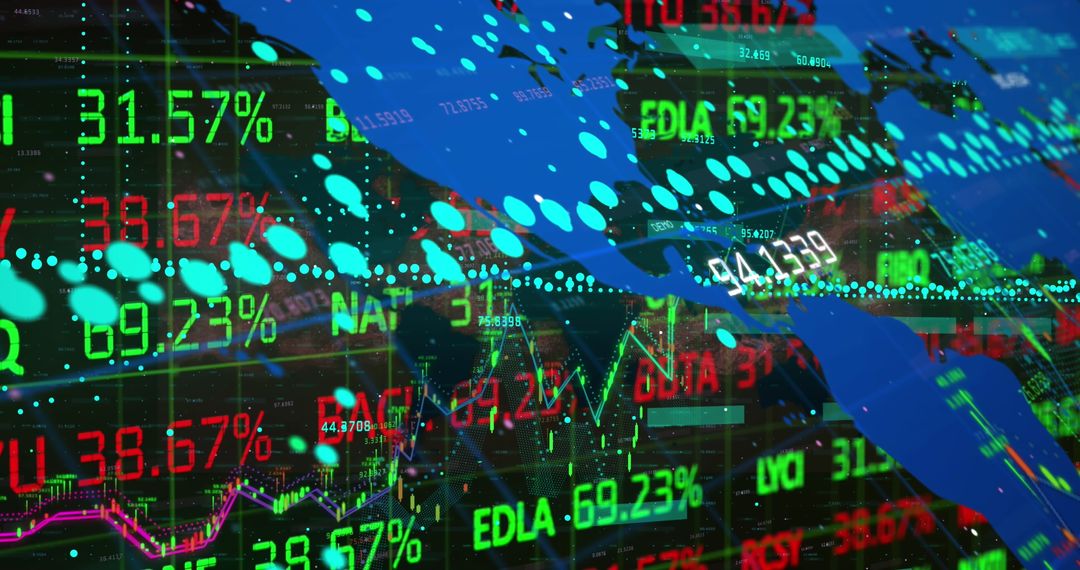
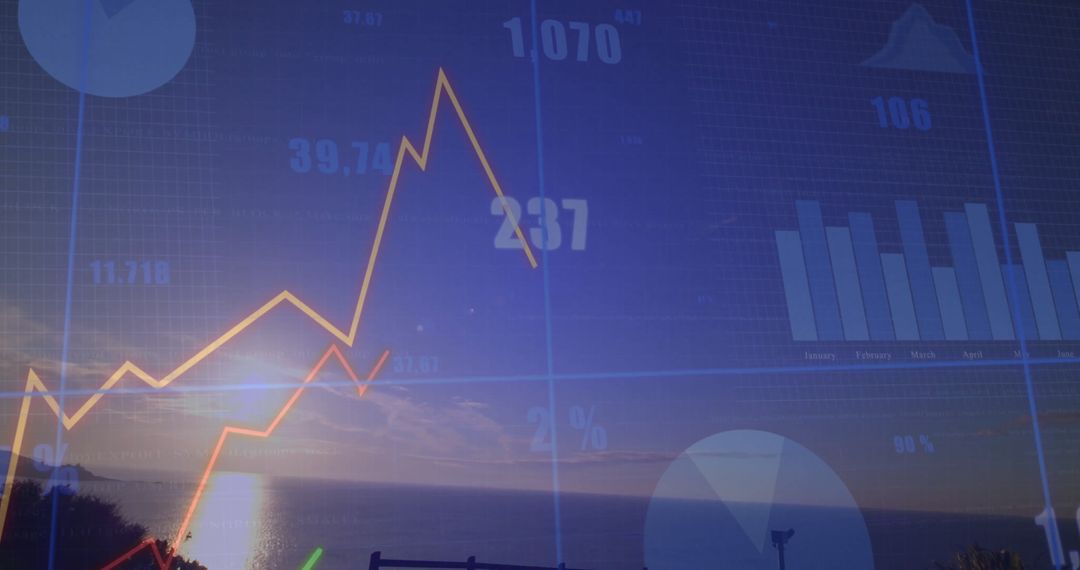
- Financial Dashboard with Rising Graphs and Currency Symbols
Financial Dashboard with Rising Graphs and Currency Symbols Image

Digital display featuring rising graphs and various charts against a backdrop of currency symbols, all essential elements for showcasing dynamic financial data and investment trends. Suitable for financial platforms, data analysis presentations, economic reviews, and investment forecasts, designed for illustrating growth and analytics.
Powered by 


0
downloads
downloads
Tags:
More
Credit Photo
If you would like to credit the Photo, here are some ways you can do so
Text Link
photo Link
<span class="text-link">
<span>
<a target="_blank" href=https://pikwizard.com/photo/financial-dashboard-with-rising-graphs-and-currency-symbols/6373e27a5e53d2a0cdc5ba977b52f311/>PikWizard</a>
</span>
</span>
<span class="image-link">
<span
style="margin: 0 0 20px 0; display: inline-block; vertical-align: middle; width: 100%;"
>
<a
target="_blank"
href="https://pikwizard.com/photo/financial-dashboard-with-rising-graphs-and-currency-symbols/6373e27a5e53d2a0cdc5ba977b52f311/"
style="text-decoration: none; font-size: 10px; margin: 0;"
>
<img src="https://pikwizard.com/pw/medium/6373e27a5e53d2a0cdc5ba977b52f311.jpg" style="margin: 0; width: 100%;" alt="" />
<p style="font-size: 12px; margin: 0;">PikWizard</p>
</a>
</span>
</span>
Free (free of charge)
Free for personal and commercial use.
Author: People Creations
Similar Free Stock Images

Premium


Premium


Premium


Premium


Premium


Premium


Premium


Premium


Premium


Premium


Premium


Premium


Premium


Premium


Premium


Premium


Premium


Premium


Premium


Premium


Premium


Premium


Premium


Premium