
- Home >
- Stock Photos >
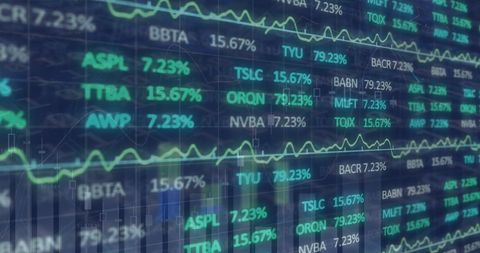
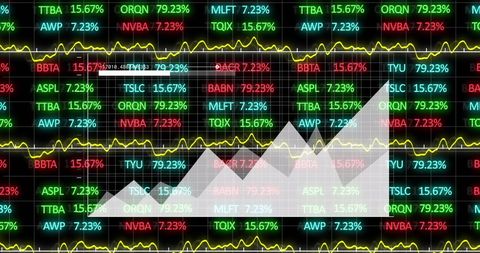
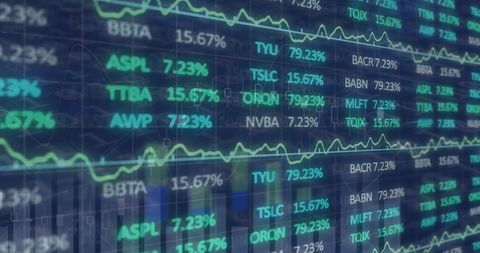
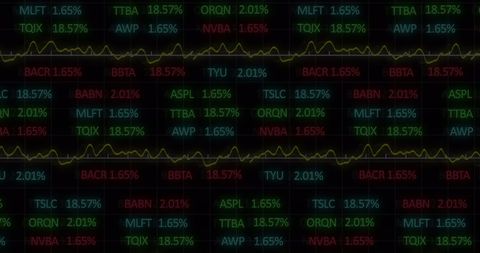
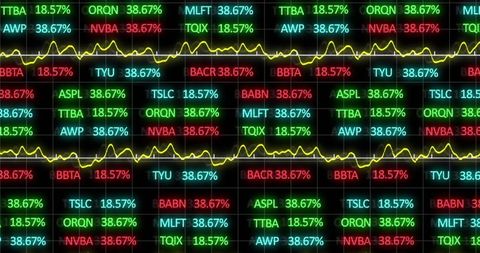
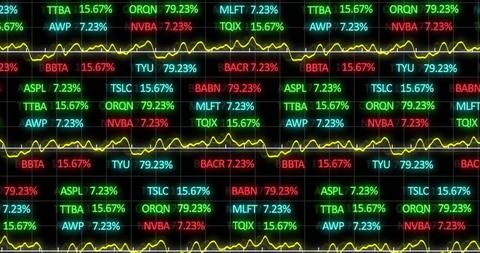
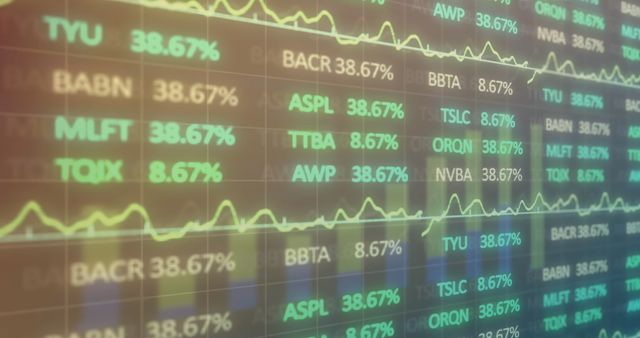
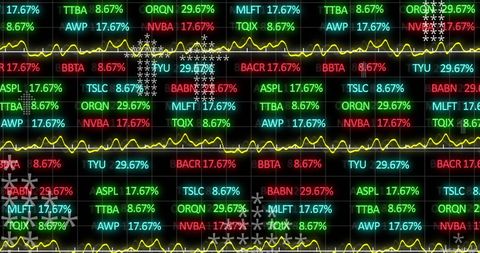
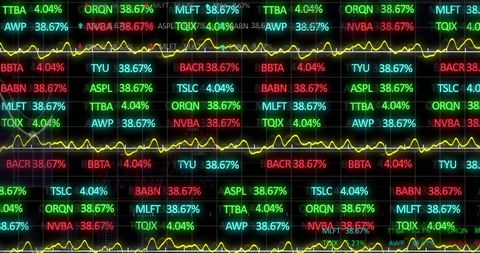
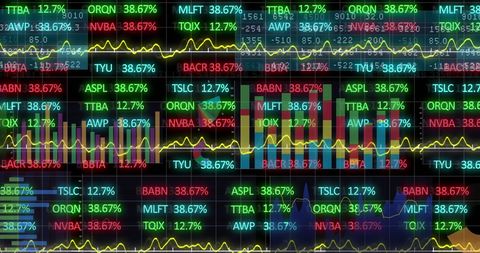
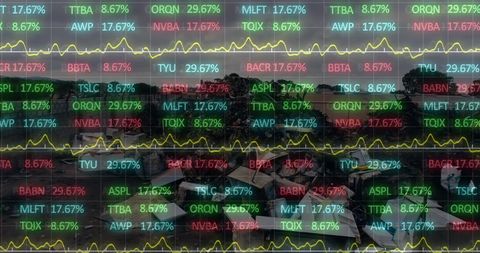
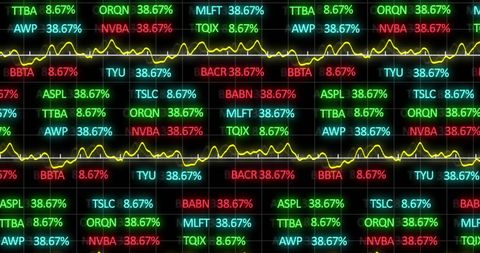
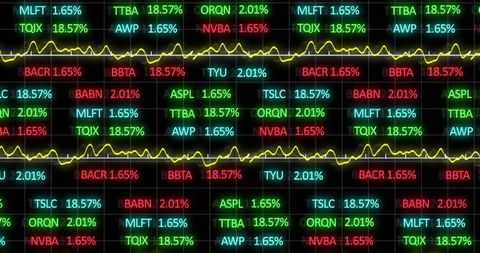
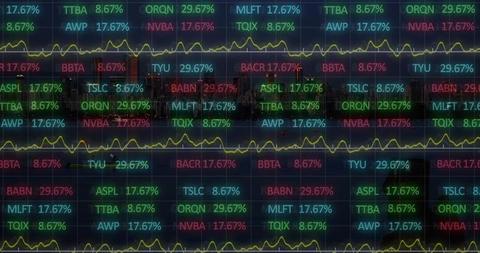
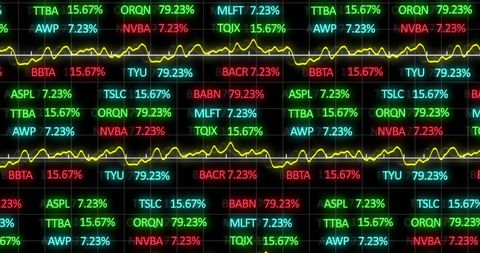
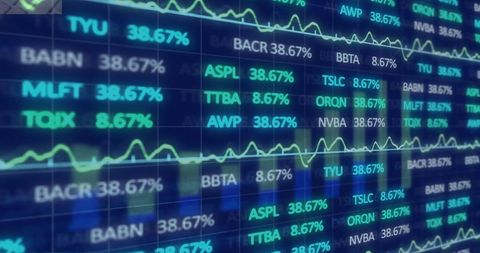
- Financial Dashboard with Stock Prices and Analytics Interface
Financial Dashboard with Stock Prices and Analytics Interface Image
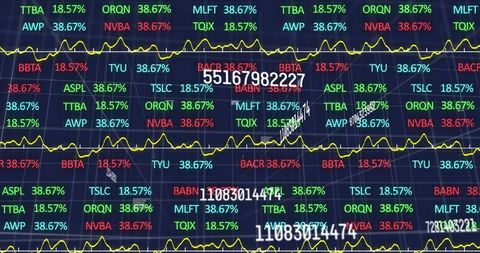
Financial dashboard overlaid with stock prices and dynamic analytics interface encapsulates the real-time movements in financial markets with vivid clarity. The colorful tickers combined with oscillating yellow graphs create a seamless depiction of digital trading environments heavily characterized by data engagement. Apt for use in financial technology backgrounds, presentations or articles focusing on data-driven investment strategies and economic trends.
Powered by  - Get 15% off with code: PIKWIZARD15


downloads
Tags:
More
Credit Photo
If you would like to credit the Photo, here are some ways you can do so
Text Link
photo Link
<span class="text-link">
<span>
<a target="_blank" href=https://pikwizard.com/photo/financial-dashboard-with-stock-prices-and-analytics-interface/f7e509d57d017e187fbbd2baabf81fe6/>PikWizard</a>
</span>
</span>
<span class="image-link">
<span
style="margin: 0 0 20px 0; display: inline-block; vertical-align: middle; width: 100%;"
>
<a
target="_blank"
href="https://pikwizard.com/photo/financial-dashboard-with-stock-prices-and-analytics-interface/f7e509d57d017e187fbbd2baabf81fe6/"
style="text-decoration: none; font-size: 10px; margin: 0;"
>
<img src="https://pikwizard.com/pw/medium/f7e509d57d017e187fbbd2baabf81fe6.jpg" style="margin: 0; width: 100%;" alt="" />
<p style="font-size: 12px; margin: 0;">PikWizard</p>
</a>
</span>
</span>
Free (free of charge)
Free for personal and commercial use.
Author: Authentic Images
Similar Free Stock Images

Premium
Premium

Premium


Premium

Premium


Premium


Premium


Premium


Premium

Premium


Premium


Premium

Premium

Premium


Premium


Premium

Premium

Premium


Premium


Premium

Premium

Premium

Premium


Premium


Premium

Explore More Free Stock Images