- Home >
- Stock Photos >
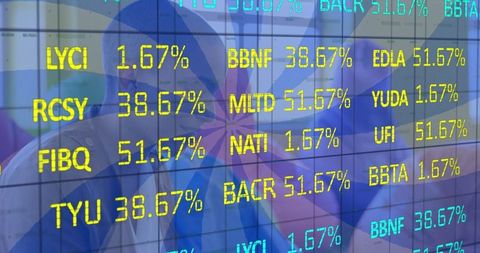
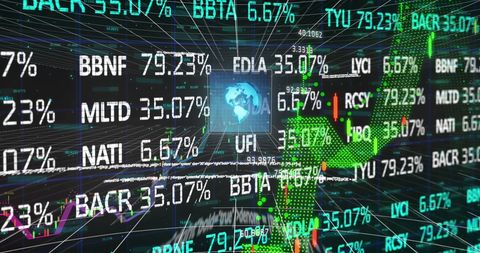
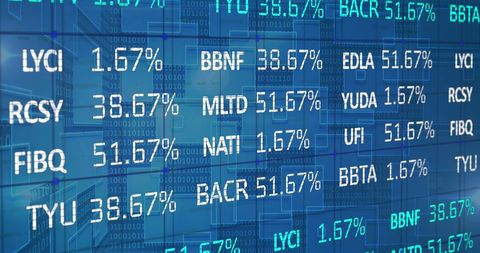
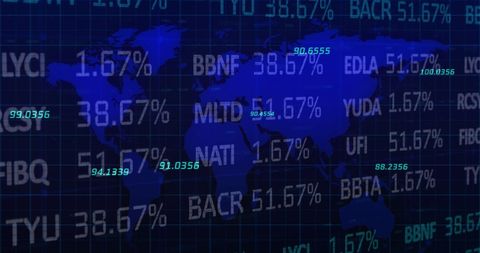
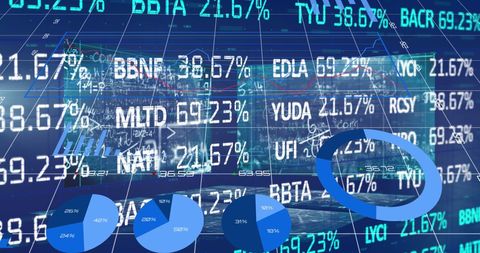
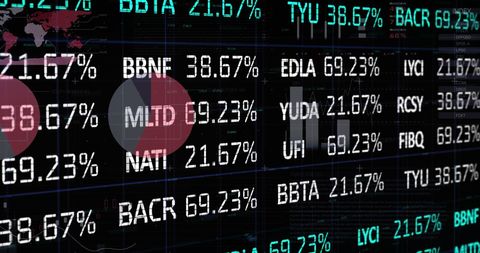
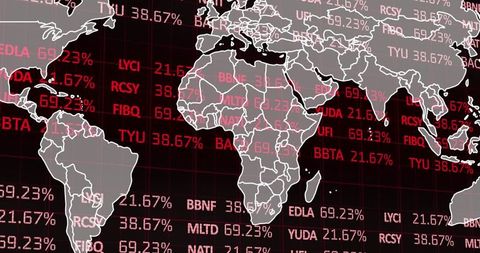
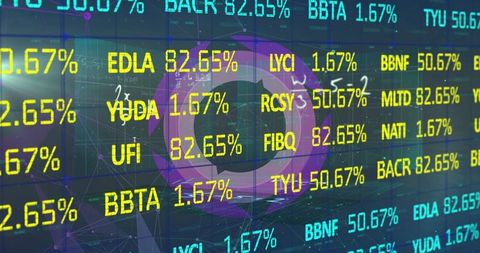
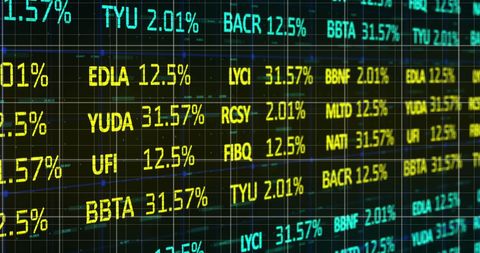
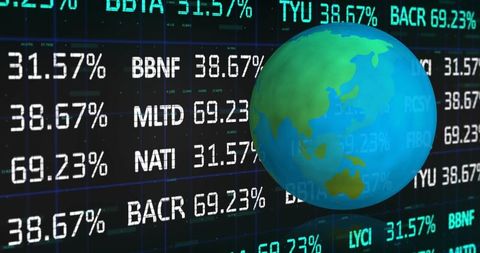
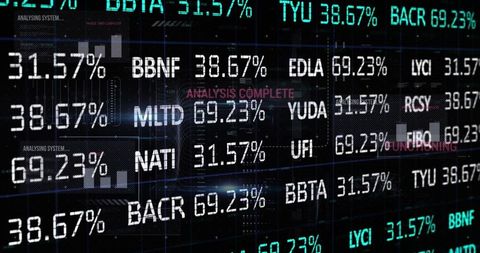
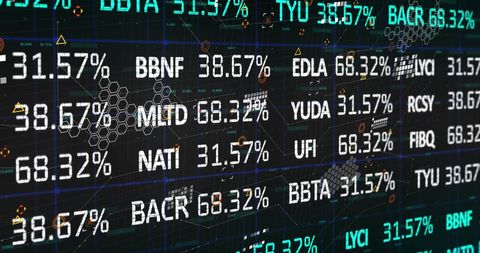
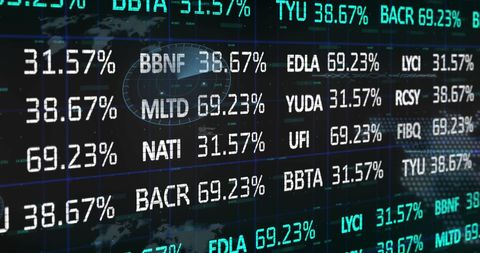
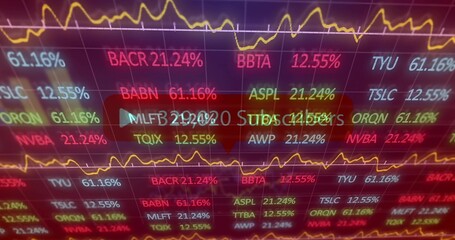
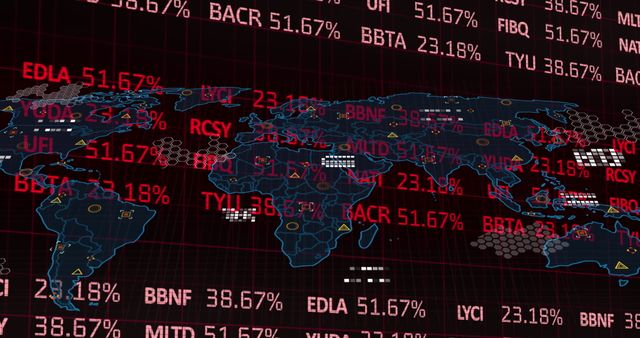
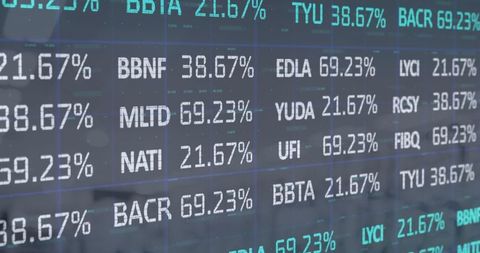
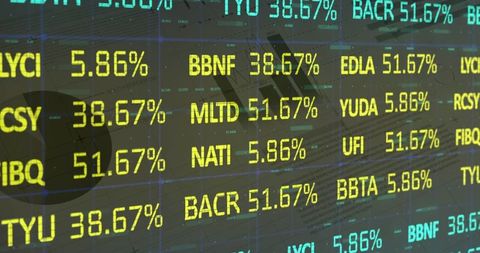
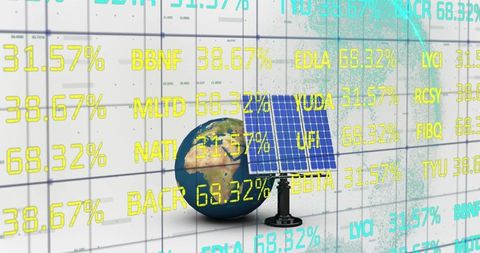
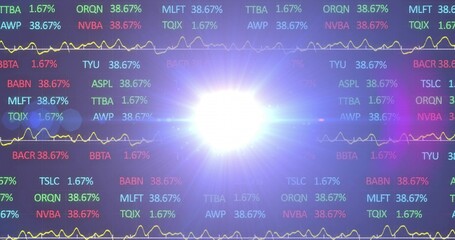
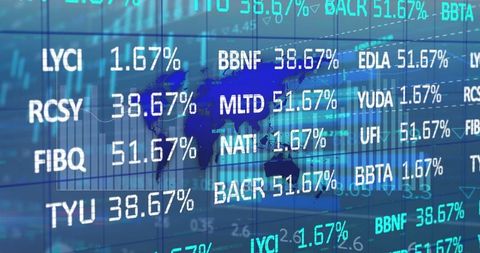
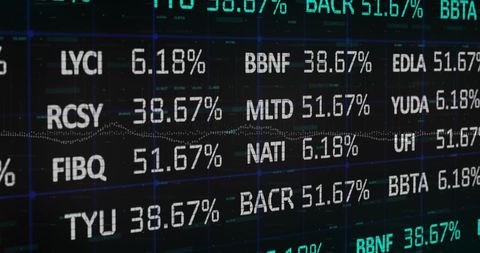
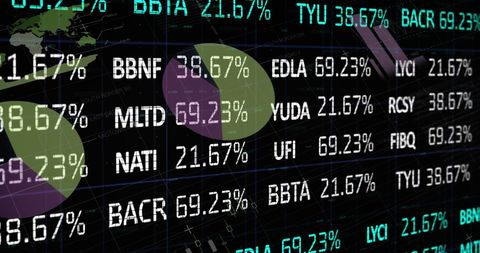
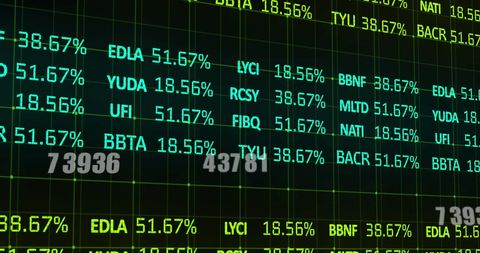
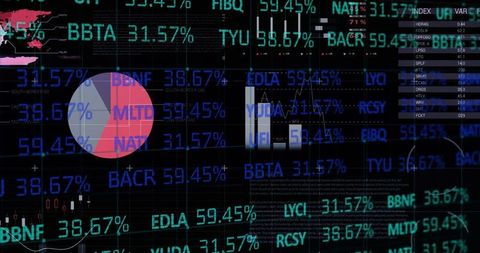
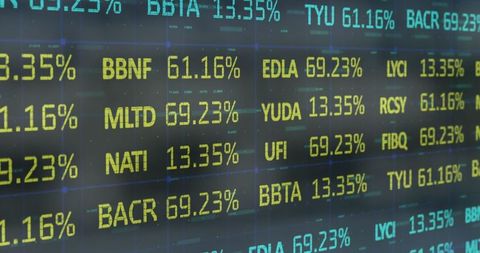
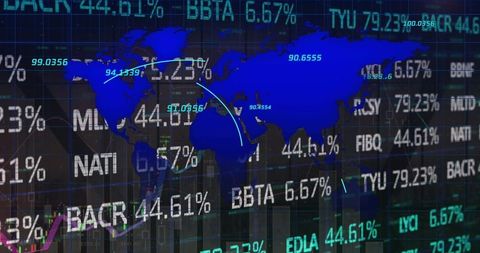
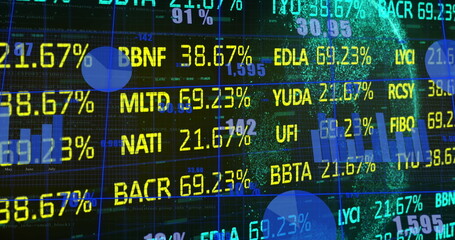
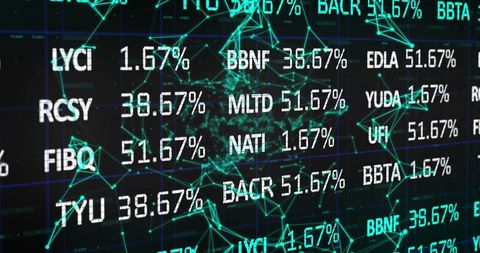
- Financial Dashboard with Stock Ticker Symbols and World Map
Financial Dashboard with Stock Ticker Symbols and World Map Image
This digital dashboard illustrates streaming financial data with ticker symbols and corresponding percentages overlaid on a world map. Ideal for use in finance-related presentations, educational materials, and investment strategy discussions. Great for technology websites, financial blogs, and platforms focused on global trade insights.
Powered by 


0
downloads
downloads
Tags:
More
Credit Photo
If you would like to credit the Photo, here are some ways you can do so
Text Link
photo Link
<span class="text-link">
<span>
<a target="_blank" href=https://pikwizard.com/photo/financial-dashboard-with-stock-ticker-symbols-and-world-map/191220c211024f38eb17a835e379413b/>PikWizard</a>
</span>
</span>
<span class="image-link">
<span
style="margin: 0 0 20px 0; display: inline-block; vertical-align: middle; width: 100%;"
>
<a
target="_blank"
href="https://pikwizard.com/photo/financial-dashboard-with-stock-ticker-symbols-and-world-map/191220c211024f38eb17a835e379413b/"
style="text-decoration: none; font-size: 10px; margin: 0;"
>
<img src="https://pikwizard.com/pw/medium/191220c211024f38eb17a835e379413b.jpg" style="margin: 0; width: 100%;" alt="" />
<p style="font-size: 12px; margin: 0;">PikWizard</p>
</a>
</span>
</span>
Free (free of charge)
Free for personal and commercial use.
Author: People Creations
Similar Free Stock Images
Loading...
Premium


Premium

Premium


Premium


Premium


Premium


Premium

Premium


Premium


Premium


Premium


Premium


Premium


Premium


Premium

Premium

Premium


Premium


Premium


Premium


Premium

Premium


Premium


Premium


Premium