
- Home >
- Stock Photos >
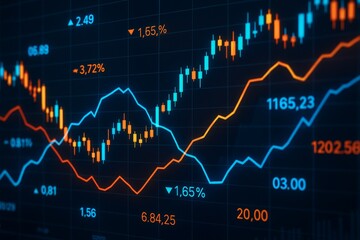
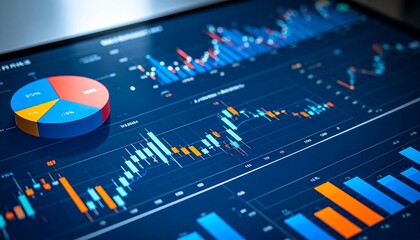
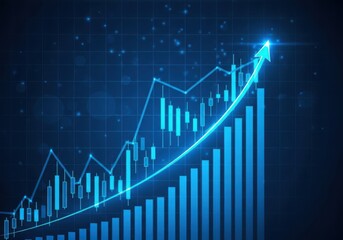
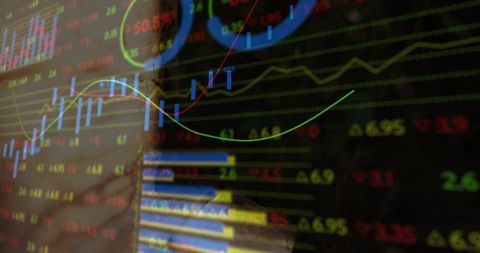
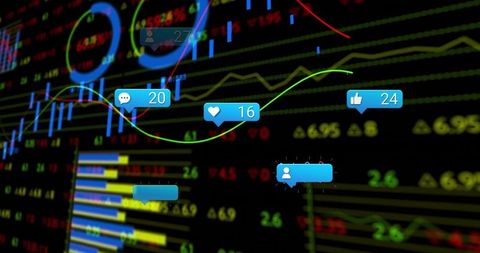
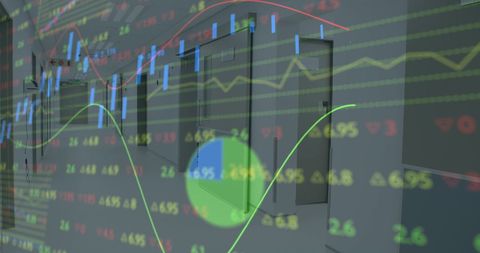
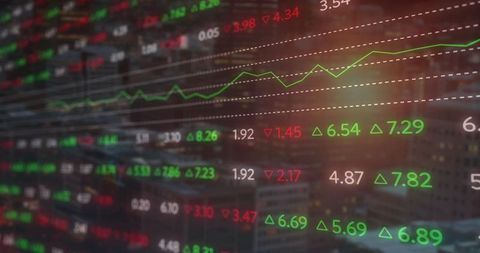
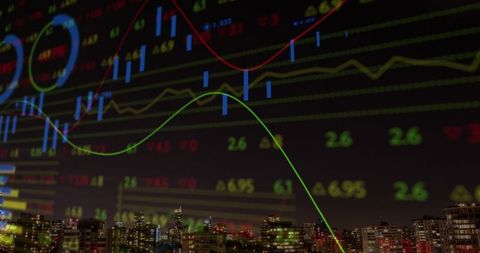
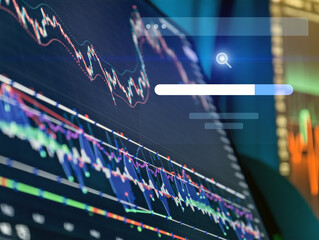
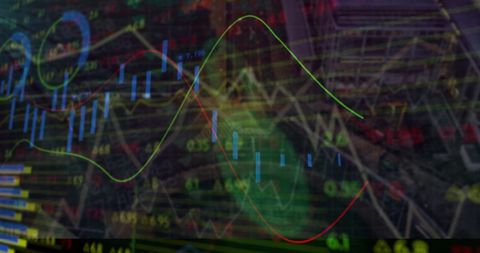
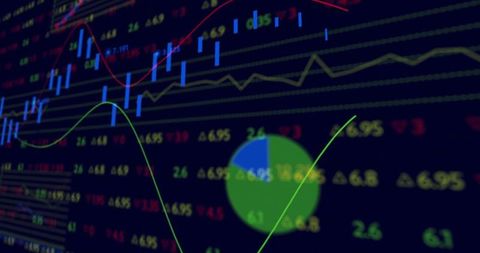
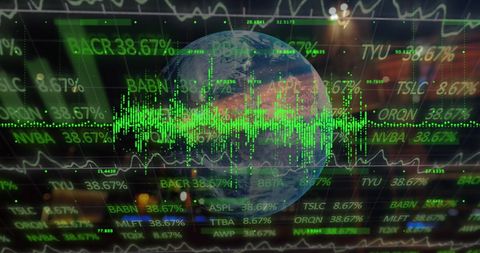
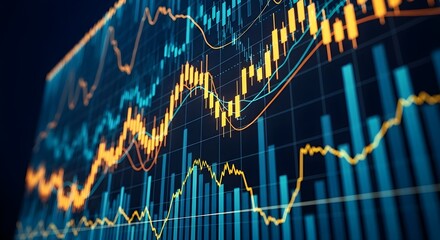
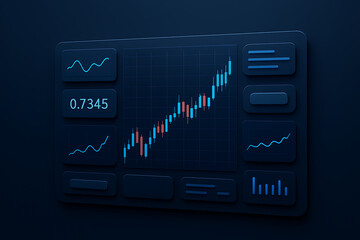
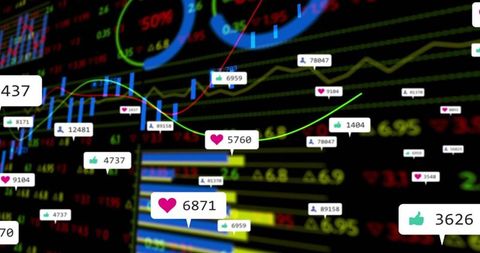
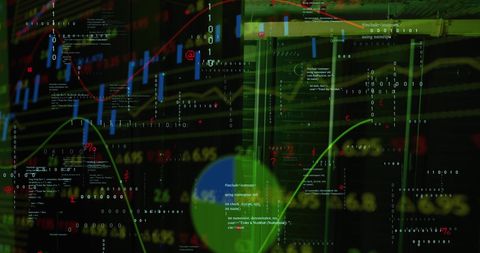
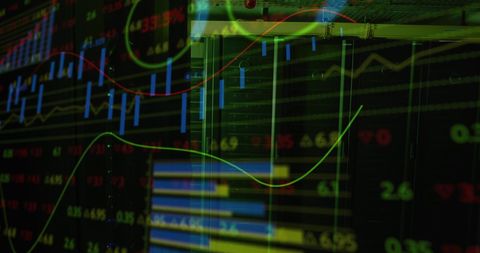
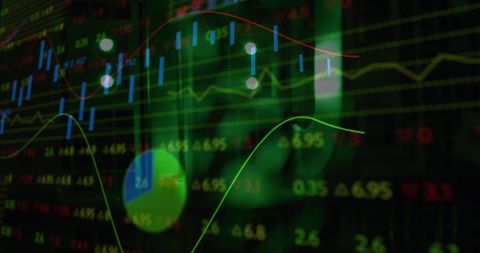
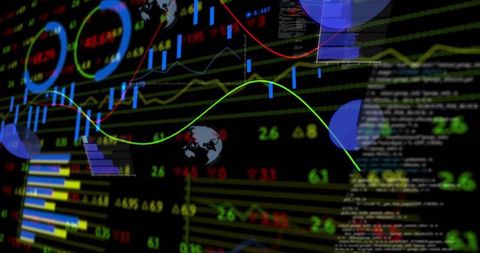
- Financial Dashboard with Trend Analysis and Data Visualization
Financial Dashboard with Trend Analysis and Data Visualization Image
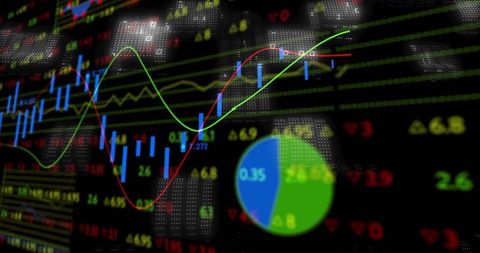
Financial dashboard showcases candlestick bars and trend lines for market analysis. Pie chart offers graphical breakdown for investment insights. Suitable for presentations, analytic tools, contemporary financial articles, marketing materials, and educational finance workshops.
Powered by 


downloads
Tags:
More
Credit Photo
If you would like to credit the Photo, here are some ways you can do so
Text Link
photo Link
<span class="text-link">
<span>
<a target="_blank" href=https://pikwizard.com/photo/financial-dashboard-with-trend-analysis-and-data-visualization/f45dca394eac90dc2a634da97f3b6def/>PikWizard</a>
</span>
</span>
<span class="image-link">
<span
style="margin: 0 0 20px 0; display: inline-block; vertical-align: middle; width: 100%;"
>
<a
target="_blank"
href="https://pikwizard.com/photo/financial-dashboard-with-trend-analysis-and-data-visualization/f45dca394eac90dc2a634da97f3b6def/"
style="text-decoration: none; font-size: 10px; margin: 0;"
>
<img src="https://pikwizard.com/pw/medium/f45dca394eac90dc2a634da97f3b6def.jpg" style="margin: 0; width: 100%;" alt="" />
<p style="font-size: 12px; margin: 0;">PikWizard</p>
</a>
</span>
</span>
Free (free of charge)
Free for personal and commercial use.
Author: Awesome Content
Similar Free Stock Images

Premium


Premium
Premium
Premium

Premium


Premium


Premium

Premium
Premium


Premium


Premium
Premium


Premium


Premium


Premium


Premium


Premium


Premium


Premium


Premium
Premium


Premium

Premium


Premium


Premium

Explore More Free Stock Images